29
/
en
AIzaSyAYiBZKx7MnpbEhh9jyipgxe19OcubqV5w
April 1, 2024
135452
Gabon
GAB
true
2
1
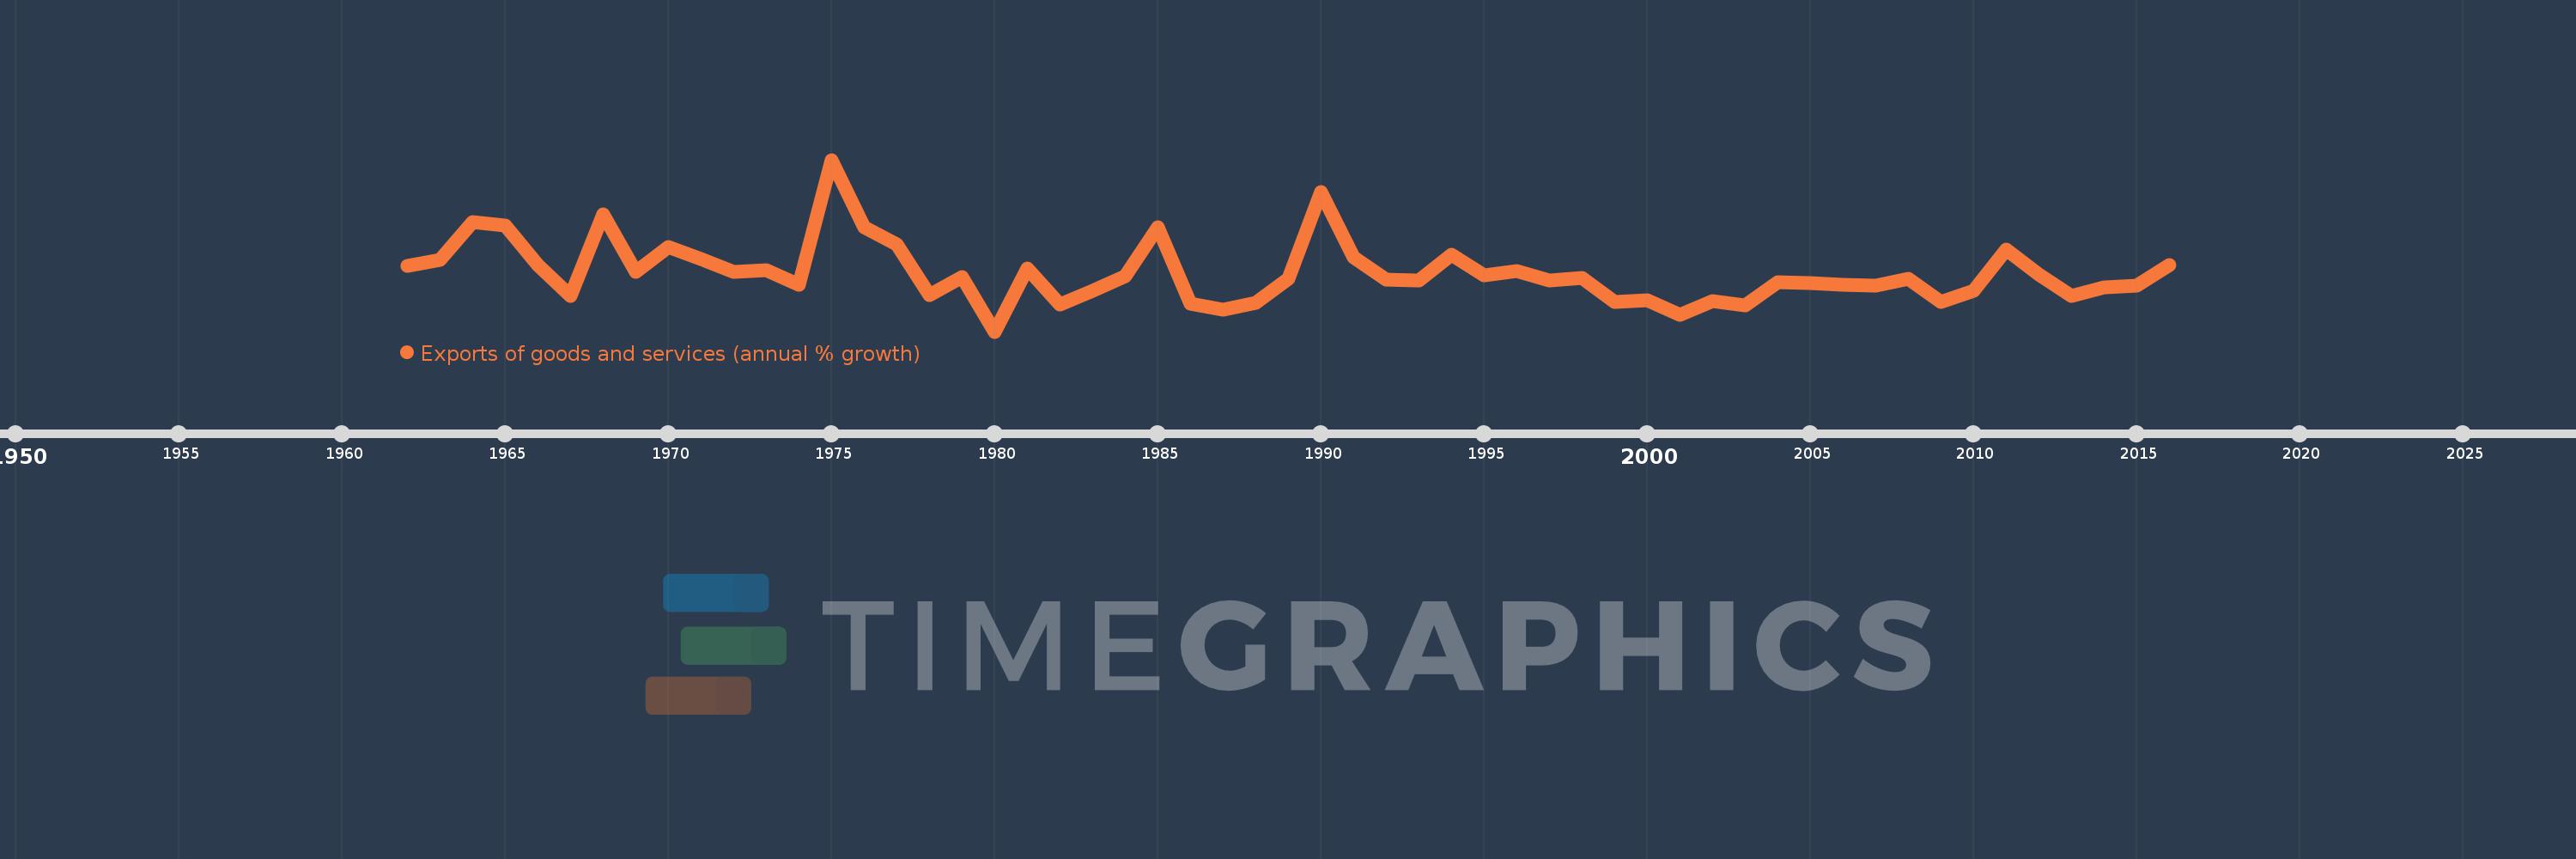
Exports of goods and services (annual % growth)
2016,2015,2014,2013,2012,2011,2010,2009,2008,2007,2006,2005,2004,2003,2002,2001,2000,1999,1998,1997,1996,1995,1994,1993,1992,1991,1990,1989,1988,1987,1986,1985,1984,1983,1982,1981,1980,1979,1978,1977,1976,1975,1974,1973,1972,1971,1970,1969,1968,1967,1966,1965,1964,1963,1962
This statistics in other country:
AlbaniaAlgeriaAngolaAntigua and BarbudaArab WorldArgentinaArmeniaAustraliaAustriaAzerbaijanBahamas, TheBahrainBangladeshBarbadosBelarusBelgiumBelizeBeninBhutanBoliviaBosnia and HerzegovinaBotswanaBrazilBrunei DarussalamBulgariaBurkina FasoBurundiCabo VerdeCambodiaCameroonCanadaCaribbean small statesCentral Europe and the BalticsChadChileColombiaComorosCongo, Dem. Rep.Congo, Rep.Costa RicaCote d'IvoireCroatiaCubaCyprusCzech RepublicDenmarkDjiboutiDominican RepublicEarly-demographic dividendEast Asia & PacificEcuadorEgypt, Arab Rep.El SalvadorEquatorial GuineaEritreaEstoniaEthiopiaEuro areaEurope & Central AsiaEurope & Central Asia (excluding high income)Europe & Central Asia (IDA & IBRD countries)European UnionFijiFinlandFranceGabonGambia, TheGeorgiaGermanyGhanaGreeceGuatemalaGuineaGuinea-BissauHaitiHeavily indebted poor countries (HIPC)High incomeHondurasHong Kong SAR, ChinaHungaryIBRD onlyIcelandIDA & IBRD totalIDA blendIDA onlyIDA totalIndiaIndonesiaIran, Islamic Rep.IrelandIsraelItalyJamaicaJapanJordanKazakhstanKenyaKorea, Rep.KosovoKuwaitKyrgyz RepublicLao PDRLatin America & Caribbean Latin America & Caribbean (excluding high income)Latin America & the Caribbean (IDA & IBRD countries)LatviaLebanonLiberiaLibyaLithuaniaLow & middle incomeLow incomeLower middle incomeLuxembourgMacao SAR, ChinaMacedonia, FYRMadagascarMalawiMalaysiaMaliMaltaMauritaniaMauritiusMexicoMiddle East & North AfricaMiddle East & North Africa (excluding high income)Middle East & North Africa (IDA & IBRD countries)Middle incomeMoldovaMongoliaMontenegroMoroccoMozambiqueMyanmarNamibiaNepalNetherlandsNew ZealandNicaraguaNigerNigeriaNorth AmericaNorwayOECD membersOmanOther small statesPakistanPanamaPapua New GuineaParaguayPeruPhilippinesPolandPortugalPost-demographic dividendPre-demographic dividendPuerto RicoQatarRomaniaRussian FederationRwandaSamoaSaudi ArabiaSenegalSerbiaSeychellesSierra LeoneSingaporeSlovak RepublicSloveniaSmall statesSomaliaSouth AfricaSouth AsiaSouth Asia (IDA & IBRD)South SudanSpainSri LankaSub-Saharan Africa Sub-Saharan Africa (excluding high income)Sub-Saharan Africa (IDA & IBRD countries)SudanSurinameSwazilandSwedenSwitzerlandSyrian Arab RepublicTajikistanTanzaniaThailandTimor-LesteTogoTrinidad and TobagoTunisiaTurkeyTurkmenistanUgandaUkraineUnited Arab EmiratesUnited KingdomUnited StatesUruguayUzbekistanVanuatuVenezuela, RBVietnamWest Bank and GazaWorldZambiaZimbabwe Timeline:
This timeline shows a graph from 1962 to 2016 of Gabon. No data until 1961. Number of actual observations by date: 55.
Source name:
World Development Indicators
Source organization:
World Bank national accounts data, and OECD National Accounts data files.
Categories, topics:
Economy & Growth, Trade
Last updated:
apr 23, 2017
Indicators value changes by year
Minimum:
-17.793
jan 1, 1980
Maximum:
50.237
jan 1, 1975
At the date of observation
Value
Absolute change
Change from previous value
jan 1, 1962
8.264
+8.264
0.0%
jan 1, 1963
10.687
+2.423
29.31%
jan 1, 1964
25.517
+14.83
138.77%
jan 1, 1965
24.176
-1.341
-5.26%
jan 1, 1966
8.407
-15.769
-65.23%
jan 1, 1967
-3.617
-12.024
-143.02%
jan 1, 1968
28.798
+32.415
-896.27%
jan 1, 1969
5.9
-22.899
-79.51%
jan 1, 1970
15.543
+9.643
163.45%
jan 1, 1971
11.012
-4.531
-29.15%
jan 1, 1972
5.844
-5.168
-46.93%
jan 1, 1973
6.383
+0.539
9.22%
jan 1, 1974
0.667
-5.717
-89.56%
jan 1, 1975
50.237
+49.57
7.44K%
jan 1, 1976
23.552
-26.685
-53.12%
jan 1, 1977
16.565
-6.987
-29.67%
jan 1, 1978
-3.389
-19.953
-120.46%
jan 1, 1979
3.779
+7.168
-211.52%
jan 1, 1980
-17.793
-21.572
-570.83%
jan 1, 1981
7.162
+24.955
-140.25%
jan 1, 1982
-7.22
-14.381
-200.81%
jan 1, 1983
-1.792
+5.427
-75.18%
jan 1, 1984
4.25
+6.043
-337.16%
jan 1, 1985
23.488
+19.237
452.6%
jan 1, 1986
-6.908
-30.396
-129.41%
jan 1, 1987
-9.214
-2.305
33.37%
jan 1, 1988
-6.369
+2.844
-30.87%
jan 1, 1989
3.288
+9.657
-151.62%
jan 1, 1990
37.585
+34.297
1.04K%
jan 1, 1991
11.696
-25.889
-68.88%
jan 1, 1992
2.913
-8.783
-75.1%
jan 1, 1993
2.553
-0.36
-12.35%
jan 1, 1994
12.541
+9.988
391.22%
jan 1, 1995
4.489
-8.052
-64.21%
jan 1, 1996
6.231
+1.742
38.81%
jan 1, 1997
2.43
-3.801
-61.0%
jan 1, 1998
3.378
+0.948
39.01%
jan 1, 1999
-6.227
-9.605
-284.33%
jan 1, 2000
-5.3
+0.927
-14.88%
jan 1, 2001
-11.2
-5.9
111.32%
jan 1, 2002
-5.786
+5.414
-48.34%
jan 1, 2003
-7.356
-1.571
27.14%
jan 1, 2004
1.801
+9.158
-124.49%
jan 1, 2005
1.331
-0.471
-26.12%
jan 1, 2006
0.609
-0.722
-54.21%
jan 1, 2007
0.391
-0.218
-35.82%
jan 1, 2008
3.084
+2.692
688.41%
jan 1, 2009
-6.053
-9.137
-296.31%
jan 1, 2010
-1.593
+4.46
-73.68%
jan 1, 2011
14.81
+16.403
-1.03K%
jan 1, 2012
4.967
-9.843
-66.46%
jan 1, 2013
-3.639
-8.606
-173.27%
jan 1, 2014
-0.343
+3.297
-90.59%
jan 1, 2015
0.397
+0.74
-215.91%
jan 1, 2016
8.659
+8.262
2.08K%
Ranking of countries by current statistics by years


Comments: