29
/
en
AIzaSyAYiBZKx7MnpbEhh9jyipgxe19OcubqV5w
April 1, 2024
223489
Philippines
PHL
true
2
1
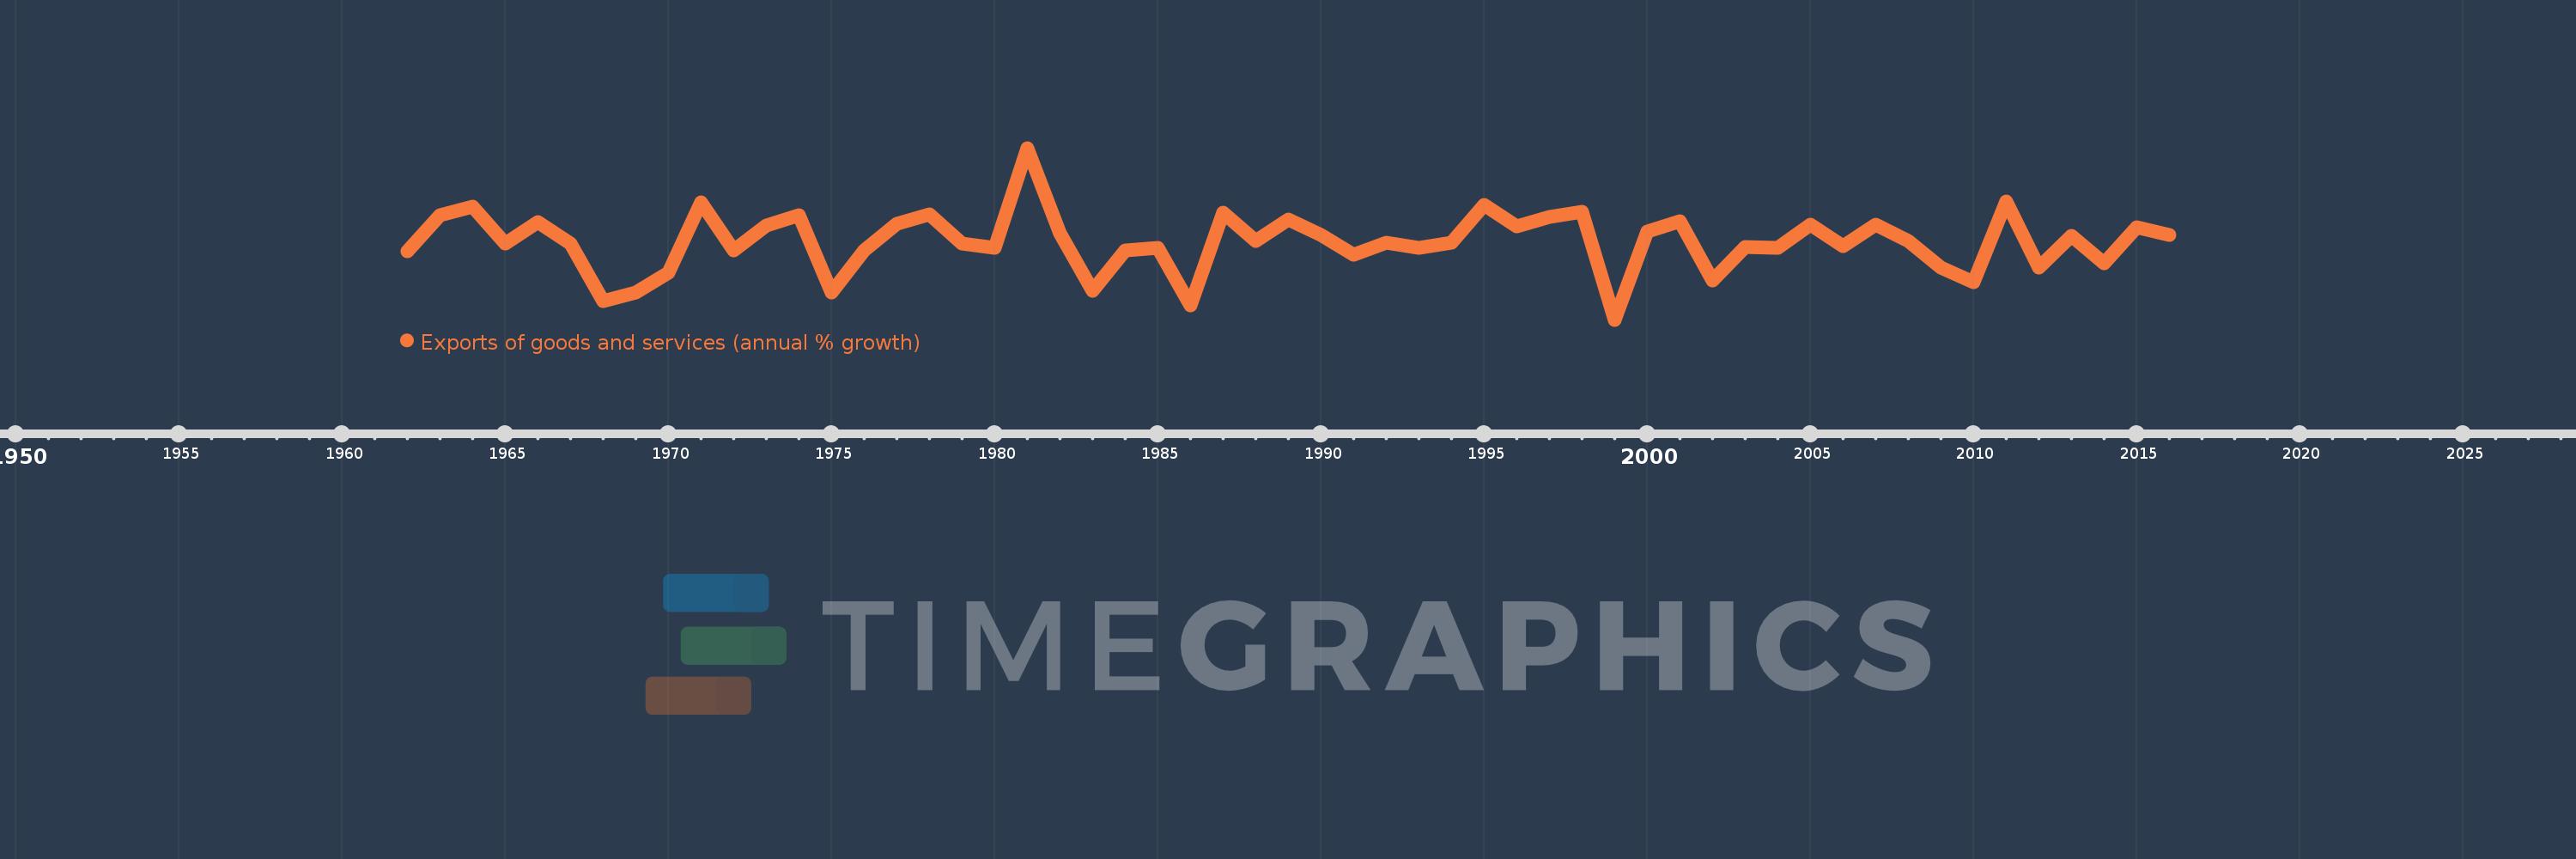
Exports of goods and services (annual % growth)
2016,2015,2014,2013,2012,2011,2010,2009,2008,2007,2006,2005,2004,2003,2002,2001,2000,1999,1998,1997,1996,1995,1994,1993,1992,1991,1990,1989,1988,1987,1986,1985,1984,1983,1982,1981,1980,1979,1978,1977,1976,1975,1974,1973,1972,1971,1970,1969,1968,1967,1966,1965,1964,1963,1962
This statistics in other country:
AlbaniaAlgeriaAngolaAntigua and BarbudaArab WorldArgentinaArmeniaAustraliaAustriaAzerbaijanBahamas, TheBahrainBangladeshBarbadosBelarusBelgiumBelizeBeninBhutanBoliviaBosnia and HerzegovinaBotswanaBrazilBrunei DarussalamBulgariaBurkina FasoBurundiCabo VerdeCambodiaCameroonCanadaCaribbean small statesCentral Europe and the BalticsChadChileColombiaComorosCongo, Dem. Rep.Congo, Rep.Costa RicaCote d'IvoireCroatiaCubaCyprusCzech RepublicDenmarkDjiboutiDominican RepublicEarly-demographic dividendEast Asia & PacificEcuadorEgypt, Arab Rep.El SalvadorEquatorial GuineaEritreaEstoniaEthiopiaEuro areaEurope & Central AsiaEurope & Central Asia (excluding high income)Europe & Central Asia (IDA & IBRD countries)European UnionFijiFinlandFranceGabonGambia, TheGeorgiaGermanyGhanaGreeceGuatemalaGuineaGuinea-BissauHaitiHeavily indebted poor countries (HIPC)High incomeHondurasHong Kong SAR, ChinaHungaryIBRD onlyIcelandIDA & IBRD totalIDA blendIDA onlyIDA totalIndiaIndonesiaIran, Islamic Rep.IrelandIsraelItalyJamaicaJapanJordanKazakhstanKenyaKorea, Rep.KosovoKuwaitKyrgyz RepublicLao PDRLatin America & Caribbean Latin America & Caribbean (excluding high income)Latin America & the Caribbean (IDA & IBRD countries)LatviaLebanonLiberiaLibyaLithuaniaLow & middle incomeLow incomeLower middle incomeLuxembourgMacao SAR, ChinaMacedonia, FYRMadagascarMalawiMalaysiaMaliMaltaMauritaniaMauritiusMexicoMiddle East & North AfricaMiddle East & North Africa (excluding high income)Middle East & North Africa (IDA & IBRD countries)Middle incomeMoldovaMongoliaMontenegroMoroccoMozambiqueMyanmarNamibiaNepalNetherlandsNew ZealandNicaraguaNigerNigeriaNorth AmericaNorwayOECD membersOmanOther small statesPakistanPanamaPapua New GuineaParaguayPeruPhilippinesPolandPortugalPost-demographic dividendPre-demographic dividendPuerto RicoQatarRomaniaRussian FederationRwandaSamoaSaudi ArabiaSenegalSerbiaSeychellesSierra LeoneSingaporeSlovak RepublicSloveniaSmall statesSomaliaSouth AfricaSouth AsiaSouth Asia (IDA & IBRD)South SudanSpainSri LankaSub-Saharan Africa Sub-Saharan Africa (excluding high income)Sub-Saharan Africa (IDA & IBRD countries)SudanSurinameSwazilandSwedenSwitzerlandSyrian Arab RepublicTajikistanTanzaniaThailandTimor-LesteTogoTrinidad and TobagoTunisiaTurkeyTurkmenistanUgandaUkraineUnited Arab EmiratesUnited KingdomUnited StatesUruguayUzbekistanVanuatuVenezuela, RBVietnamWest Bank and GazaWorldZambiaZimbabwe Timeline:
This timeline shows a graph from 1962 to 2016 of Philippines. No data until 1961. Number of actual observations by date: 55.
Source name:
World Development Indicators
Source organization:
World Bank national accounts data, and OECD National Accounts data files.
Categories, topics:
Economy & Growth, Trade
Last updated:
apr 23, 2017
Indicators value changes by year
Minimum:
-21.034
jan 1, 1999
Maximum:
39.818
jan 1, 1981
At the date of observation
Value
Absolute change
Change from previous value
jan 1, 1962
3.308
+3.308
0.0%
jan 1, 1963
15.892
+12.583
380.35%
jan 1, 1964
19.092
+3.2
20.14%
jan 1, 1965
5.997
-13.095
-68.59%
jan 1, 1966
13.596
+7.598
126.7%
jan 1, 1967
6.098
-7.497
-55.15%
jan 1, 1968
-14.421
-20.519
-336.47%
jan 1, 1969
-11.275
+3.145
-21.81%
jan 1, 1970
-4.372
+6.904
-61.23%
jan 1, 1971
20.611
+24.982
-571.47%
jan 1, 1972
3.413
-17.198
-83.44%
jan 1, 1973
12.489
+9.075
265.89%
jan 1, 1974
16.048
+3.56
28.5%
jan 1, 1975
-11.41
-27.458
-171.1%
jan 1, 1976
3.534
+14.944
-130.97%
jan 1, 1977
12.829
+9.295
263.06%
jan 1, 1978
16.413
+3.585
27.94%
jan 1, 1979
6.055
-10.358
-63.11%
jan 1, 1980
4.294
-1.761
-29.08%
jan 1, 1981
39.818
+35.524
827.27%
jan 1, 1982
9.475
-30.343
-76.2%
jan 1, 1983
-10.686
-20.162
-212.78%
jan 1, 1984
3.449
+14.135
-132.27%
jan 1, 1985
4.544
+1.096
31.77%
jan 1, 1986
-16.07
-20.615
-453.63%
jan 1, 1987
16.914
+32.984
-205.25%
jan 1, 1988
6.826
-10.088
-59.65%
jan 1, 1989
14.532
+7.706
112.9%
jan 1, 1990
8.872
-5.66
-38.95%
jan 1, 1991
1.859
-7.013
-79.04%
jan 1, 1992
6.265
+4.406
236.96%
jan 1, 1993
4.283
-1.982
-31.64%
jan 1, 1994
6.221
+1.938
45.25%
jan 1, 1995
19.791
+13.57
218.12%
jan 1, 1996
12.036
-7.755
-39.18%
jan 1, 1997
15.405
+3.368
27.99%
jan 1, 1998
17.15
+1.746
11.33%
jan 1, 1999
-21.034
-38.184
-222.64%
jan 1, 2000
10.167
+31.201
-148.34%
jan 1, 2001
13.723
+3.556
34.98%
jan 1, 2002
-7.066
-20.789
-151.49%
jan 1, 2003
4.662
+11.728
-165.98%
jan 1, 2004
4.511
-0.152
-3.25%
jan 1, 2005
12.76
+8.249
182.88%
jan 1, 2006
4.952
-7.808
-61.19%
jan 1, 2007
12.598
+7.645
154.37%
jan 1, 2008
6.748
-5.85
-46.44%
jan 1, 2009
-2.676
-9.423
-139.65%
jan 1, 2010
-7.832
-5.156
192.72%
jan 1, 2011
20.971
+28.803
-367.76%
jan 1, 2012
-2.535
-23.506
-112.09%
jan 1, 2013
8.579
+11.114
-438.41%
jan 1, 2014
-0.971
-9.549
-111.31%
jan 1, 2015
11.682
+12.653
-1.3K%
jan 1, 2016
8.975
-2.707
-23.17%
Ranking of countries by current statistics by years


Comments: