29
/
en
AIzaSyAYiBZKx7MnpbEhh9jyipgxe19OcubqV5w
April 1, 2024
187717
Malaysia
MYS
true
2
1
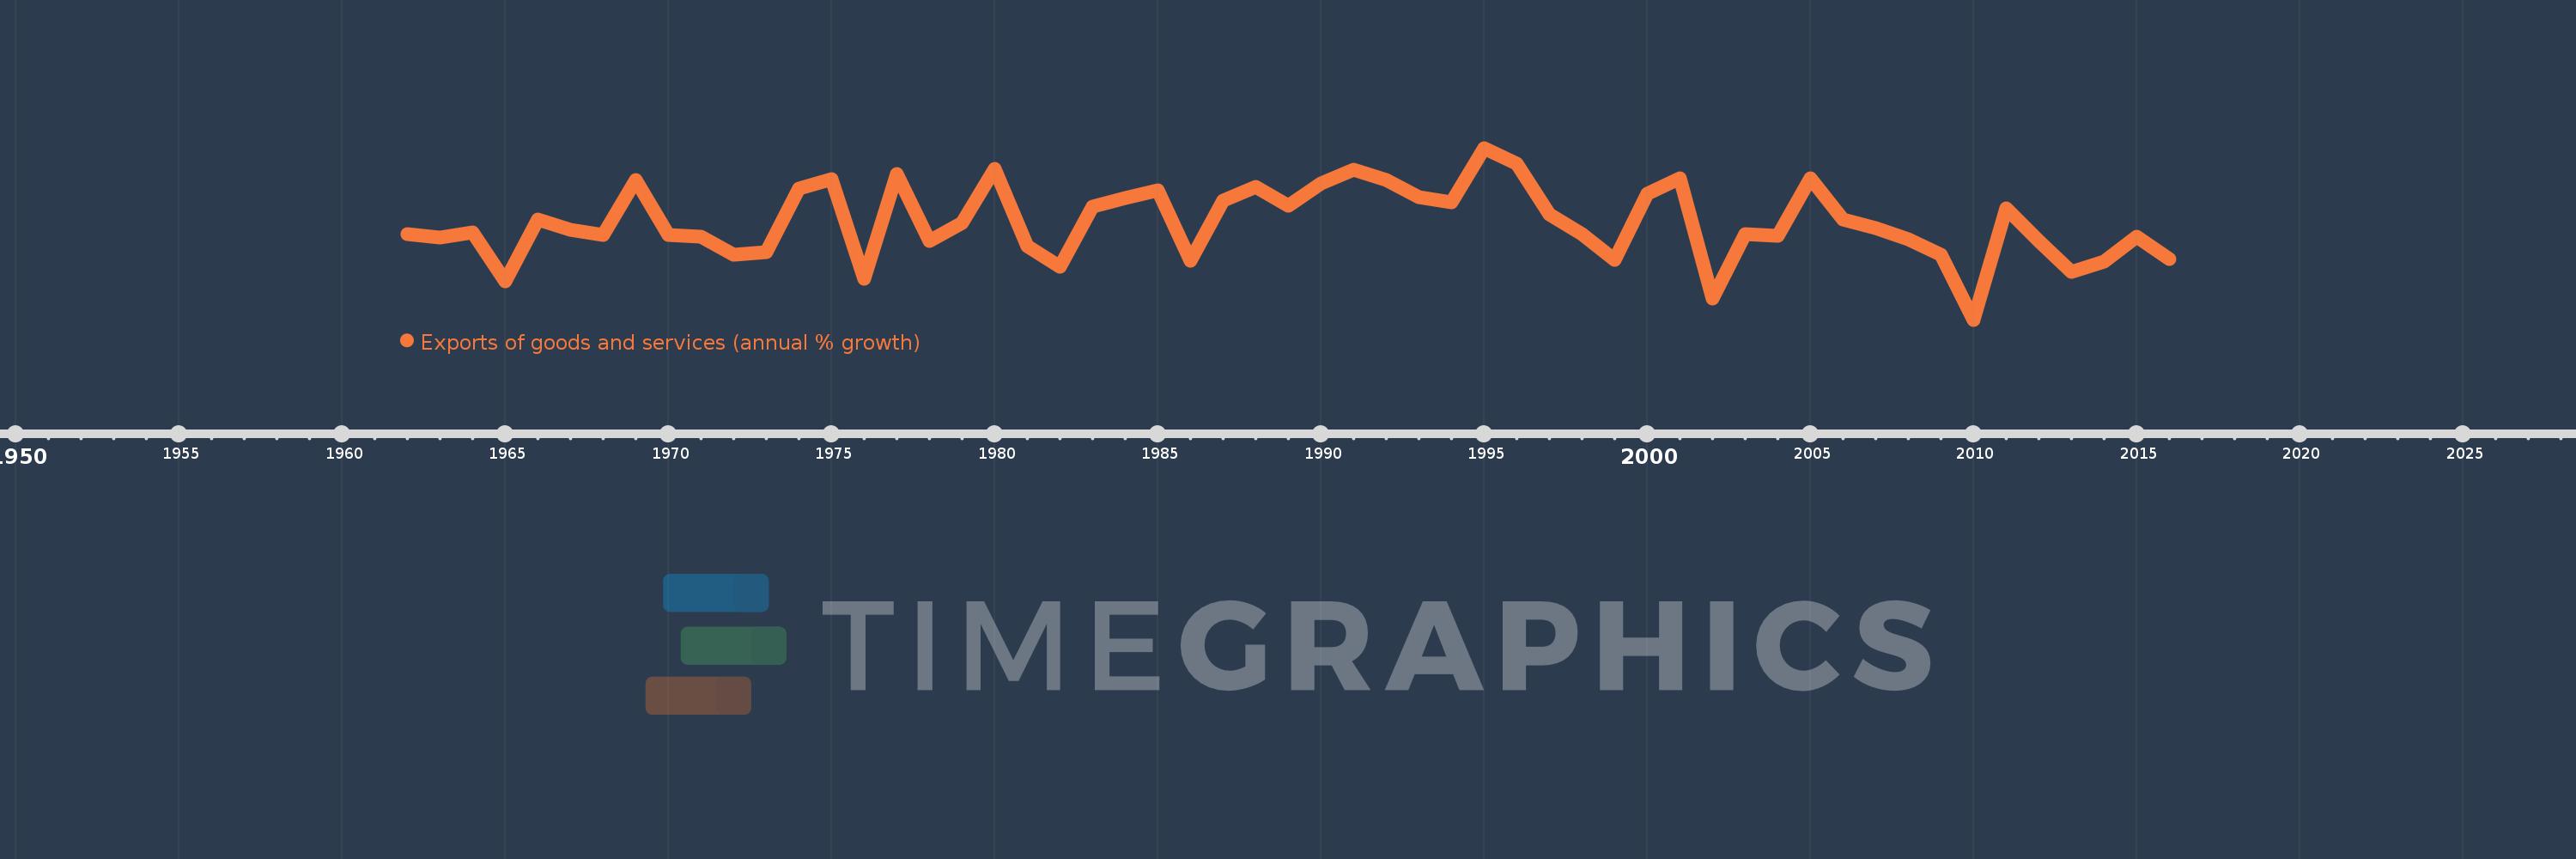
Exports of goods and services (annual % growth)
2016,2015,2014,2013,2012,2011,2010,2009,2008,2007,2006,2005,2004,2003,2002,2001,2000,1999,1998,1997,1996,1995,1994,1993,1992,1991,1990,1989,1988,1987,1986,1985,1984,1983,1982,1981,1980,1979,1978,1977,1976,1975,1974,1973,1972,1971,1970,1969,1968,1967,1966,1965,1964,1963,1962
This statistics in other country:
AlbaniaAlgeriaAngolaAntigua and BarbudaArab WorldArgentinaArmeniaAustraliaAustriaAzerbaijanBahamas, TheBahrainBangladeshBarbadosBelarusBelgiumBelizeBeninBhutanBoliviaBosnia and HerzegovinaBotswanaBrazilBrunei DarussalamBulgariaBurkina FasoBurundiCabo VerdeCambodiaCameroonCanadaCaribbean small statesCentral Europe and the BalticsChadChileColombiaComorosCongo, Dem. Rep.Congo, Rep.Costa RicaCote d'IvoireCroatiaCubaCyprusCzech RepublicDenmarkDjiboutiDominican RepublicEarly-demographic dividendEast Asia & PacificEcuadorEgypt, Arab Rep.El SalvadorEquatorial GuineaEritreaEstoniaEthiopiaEuro areaEurope & Central AsiaEurope & Central Asia (excluding high income)Europe & Central Asia (IDA & IBRD countries)European UnionFijiFinlandFranceGabonGambia, TheGeorgiaGermanyGhanaGreeceGuatemalaGuineaGuinea-BissauHaitiHeavily indebted poor countries (HIPC)High incomeHondurasHong Kong SAR, ChinaHungaryIBRD onlyIcelandIDA & IBRD totalIDA blendIDA onlyIDA totalIndiaIndonesiaIran, Islamic Rep.IrelandIsraelItalyJamaicaJapanJordanKazakhstanKenyaKorea, Rep.KosovoKuwaitKyrgyz RepublicLao PDRLatin America & Caribbean Latin America & Caribbean (excluding high income)Latin America & the Caribbean (IDA & IBRD countries)LatviaLebanonLiberiaLibyaLithuaniaLow & middle incomeLow incomeLower middle incomeLuxembourgMacao SAR, ChinaMacedonia, FYRMadagascarMalawiMalaysiaMaliMaltaMauritaniaMauritiusMexicoMiddle East & North AfricaMiddle East & North Africa (excluding high income)Middle East & North Africa (IDA & IBRD countries)Middle incomeMoldovaMongoliaMontenegroMoroccoMozambiqueMyanmarNamibiaNepalNetherlandsNew ZealandNicaraguaNigerNigeriaNorth AmericaNorwayOECD membersOmanOther small statesPakistanPanamaPapua New GuineaParaguayPeruPhilippinesPolandPortugalPost-demographic dividendPre-demographic dividendPuerto RicoQatarRomaniaRussian FederationRwandaSamoaSaudi ArabiaSenegalSerbiaSeychellesSierra LeoneSingaporeSlovak RepublicSloveniaSmall statesSomaliaSouth AfricaSouth AsiaSouth Asia (IDA & IBRD)South SudanSpainSri LankaSub-Saharan Africa Sub-Saharan Africa (excluding high income)Sub-Saharan Africa (IDA & IBRD countries)SudanSurinameSwazilandSwedenSwitzerlandSyrian Arab RepublicTajikistanTanzaniaThailandTimor-LesteTogoTrinidad and TobagoTunisiaTurkeyTurkmenistanUgandaUkraineUnited Arab EmiratesUnited KingdomUnited StatesUruguayUzbekistanVanuatuVenezuela, RBVietnamWest Bank and GazaWorldZambiaZimbabwe Timeline:
This timeline shows a graph from 1962 to 2016 of Malaysia. No data until 1961. Number of actual observations by date: 55.
Source name:
World Development Indicators
Source organization:
World Bank national accounts data, and OECD National Accounts data files.
Categories, topics:
Economy & Growth, Trade
Last updated:
apr 23, 2017
Indicators value changes by year
Minimum:
-10.878
jan 1, 2010
Maximum:
21.907
jan 1, 1995
At the date of observation
Value
Absolute change
Change from previous value
jan 1, 1962
5.535
+5.535
0.0%
jan 1, 1963
4.807
-0.727
-13.14%
jan 1, 1964
5.853
+1.045
21.74%
jan 1, 1965
-3.475
-9.328
-159.37%
jan 1, 1966
8.293
+11.768
-338.66%
jan 1, 1967
6.245
-2.048
-24.7%
jan 1, 1968
5.359
-0.886
-14.19%
jan 1, 1969
15.859
+10.501
195.96%
jan 1, 1970
5.376
-10.483
-66.1%
jan 1, 1971
4.954
-0.422
-7.85%
jan 1, 1972
1.558
-3.396
-68.56%
jan 1, 1973
2.023
+0.466
29.9%
jan 1, 1974
14.191
+12.168
601.33%
jan 1, 1975
15.925
+1.734
12.22%
jan 1, 1976
-2.997
-18.922
-118.82%
jan 1, 1977
16.962
+19.958
-666.05%
jan 1, 1978
4.161
-12.801
-75.47%
jan 1, 1979
7.589
+3.429
82.41%
jan 1, 1980
17.966
+10.377
136.73%
jan 1, 1981
3.17
-14.796
-82.36%
jan 1, 1982
-0.831
-4.001
-126.22%
jan 1, 1983
10.677
+11.508
-1.38K%
jan 1, 1984
12.338
+1.661
15.55%
jan 1, 1985
13.783
+1.445
11.71%
jan 1, 1986
0.447
-13.336
-96.75%
jan 1, 1987
11.787
+11.339
2.53K%
jan 1, 1988
14.557
+2.77
23.51%
jan 1, 1989
10.898
-3.659
-25.13%
jan 1, 1990
15.194
+4.295
39.41%
jan 1, 1991
17.819
+2.625
17.28%
jan 1, 1992
15.77
-2.049
-11.5%
jan 1, 1993
12.596
-3.175
-20.13%
jan 1, 1994
11.543
-1.053
-8.36%
jan 1, 1995
21.907
+10.364
89.79%
jan 1, 1996
18.965
-2.942
-13.43%
jan 1, 1997
9.228
-9.737
-51.34%
jan 1, 1998
5.491
-3.737
-40.5%
jan 1, 1999
0.491
-4.999
-91.05%
jan 1, 2000
13.163
+12.672
2.58K%
jan 1, 2001
16.066
+2.902
22.05%
jan 1, 2002
-6.83
-22.896
-142.51%
jan 1, 2003
5.427
+12.257
-179.46%
jan 1, 2004
5.134
-0.293
-5.41%
jan 1, 2005
16.058
+10.924
212.79%
jan 1, 2006
8.302
-7.756
-48.3%
jan 1, 2007
6.682
-1.62
-19.51%
jan 1, 2008
4.429
-2.254
-33.73%
jan 1, 2009
1.573
-2.855
-64.48%
jan 1, 2010
-10.878
-12.452
-791.53%
jan 1, 2011
10.419
+21.298
-195.78%
jan 1, 2012
4.179
-6.24
-59.89%
jan 1, 2013
-1.742
-5.921
-141.68%
jan 1, 2014
0.259
+2.001
-114.88%
jan 1, 2015
5.04
+4.781
1.84K%
jan 1, 2016
0.633
-4.407
-87.44%
Ranking of countries by current statistics by years


Comments: