29
/
en
AIzaSyAYiBZKx7MnpbEhh9jyipgxe19OcubqV5w
April 1, 2024
133089
Finland
FIN
true
2
1
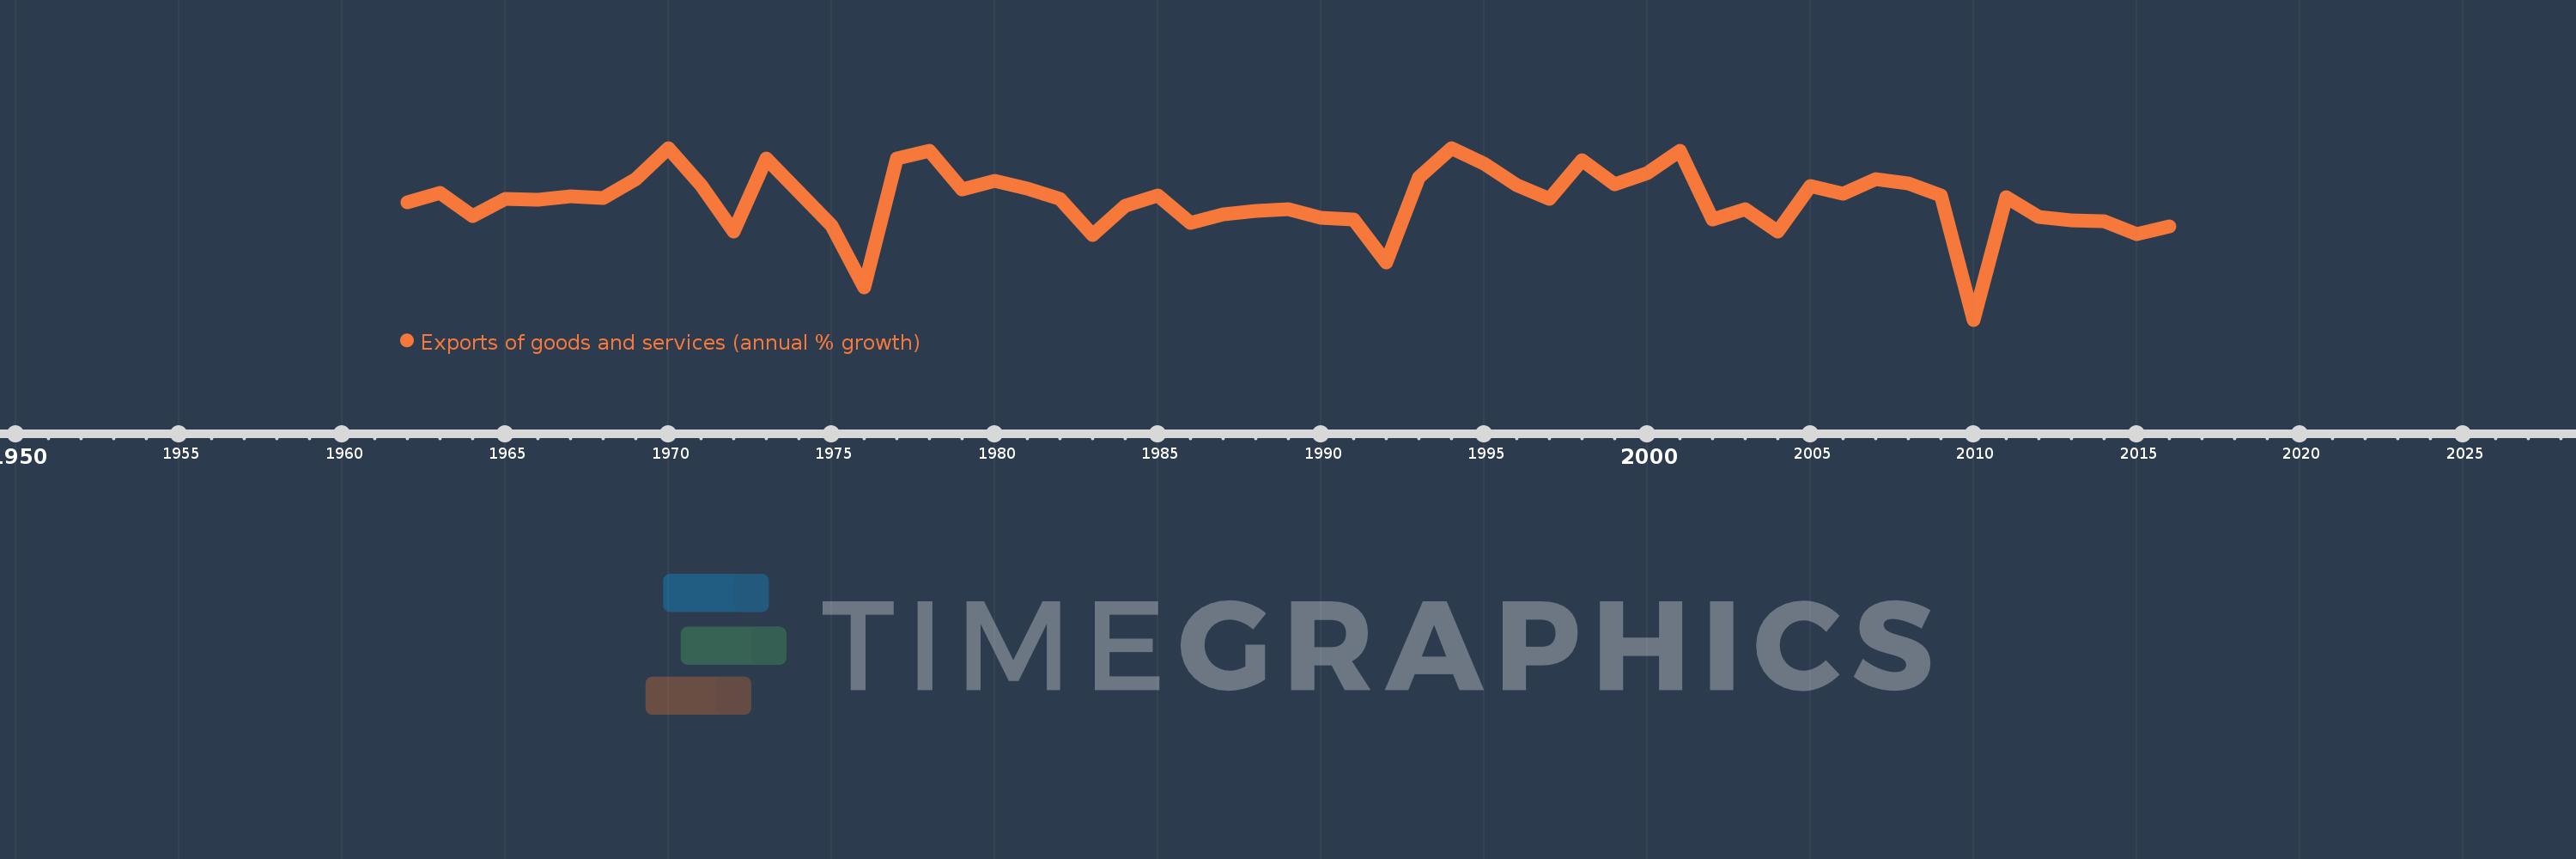
Exports of goods and services (annual % growth)
2016,2015,2014,2013,2012,2011,2010,2009,2008,2007,2006,2005,2004,2003,2002,2001,2000,1999,1998,1997,1996,1995,1994,1993,1992,1991,1990,1989,1988,1987,1986,1985,1984,1983,1982,1981,1980,1979,1978,1977,1976,1975,1974,1973,1972,1971,1970,1969,1968,1967,1966,1965,1964,1963,1962
This statistics in other country:
AlbaniaAlgeriaAngolaAntigua and BarbudaArab WorldArgentinaArmeniaAustraliaAustriaAzerbaijanBahamas, TheBahrainBangladeshBarbadosBelarusBelgiumBelizeBeninBhutanBoliviaBosnia and HerzegovinaBotswanaBrazilBrunei DarussalamBulgariaBurkina FasoBurundiCabo VerdeCambodiaCameroonCanadaCaribbean small statesCentral Europe and the BalticsChadChileColombiaComorosCongo, Dem. Rep.Congo, Rep.Costa RicaCote d'IvoireCroatiaCubaCyprusCzech RepublicDenmarkDjiboutiDominican RepublicEarly-demographic dividendEast Asia & PacificEcuadorEgypt, Arab Rep.El SalvadorEquatorial GuineaEritreaEstoniaEthiopiaEuro areaEurope & Central AsiaEurope & Central Asia (excluding high income)Europe & Central Asia (IDA & IBRD countries)European UnionFijiFinlandFranceGabonGambia, TheGeorgiaGermanyGhanaGreeceGuatemalaGuineaGuinea-BissauHaitiHeavily indebted poor countries (HIPC)High incomeHondurasHong Kong SAR, ChinaHungaryIBRD onlyIcelandIDA & IBRD totalIDA blendIDA onlyIDA totalIndiaIndonesiaIran, Islamic Rep.IrelandIsraelItalyJamaicaJapanJordanKazakhstanKenyaKorea, Rep.KosovoKuwaitKyrgyz RepublicLao PDRLatin America & Caribbean Latin America & Caribbean (excluding high income)Latin America & the Caribbean (IDA & IBRD countries)LatviaLebanonLiberiaLibyaLithuaniaLow & middle incomeLow incomeLower middle incomeLuxembourgMacao SAR, ChinaMacedonia, FYRMadagascarMalawiMalaysiaMaliMaltaMauritaniaMauritiusMexicoMiddle East & North AfricaMiddle East & North Africa (excluding high income)Middle East & North Africa (IDA & IBRD countries)Middle incomeMoldovaMongoliaMontenegroMoroccoMozambiqueMyanmarNamibiaNepalNetherlandsNew ZealandNicaraguaNigerNigeriaNorth AmericaNorwayOECD membersOmanOther small statesPakistanPanamaPapua New GuineaParaguayPeruPhilippinesPolandPortugalPost-demographic dividendPre-demographic dividendPuerto RicoQatarRomaniaRussian FederationRwandaSamoaSaudi ArabiaSenegalSerbiaSeychellesSierra LeoneSingaporeSlovak RepublicSloveniaSmall statesSomaliaSouth AfricaSouth AsiaSouth Asia (IDA & IBRD)South SudanSpainSri LankaSub-Saharan Africa Sub-Saharan Africa (excluding high income)Sub-Saharan Africa (IDA & IBRD countries)SudanSurinameSwazilandSwedenSwitzerlandSyrian Arab RepublicTajikistanTanzaniaThailandTimor-LesteTogoTrinidad and TobagoTunisiaTurkeyTurkmenistanUgandaUkraineUnited Arab EmiratesUnited KingdomUnited StatesUruguayUzbekistanVanuatuVenezuela, RBVietnamWest Bank and GazaWorldZambiaZimbabwe Timeline:
This timeline shows a graph from 1962 to 2016 of Finland. No data until 1961. Number of actual observations by date: 55.
Source name:
World Development Indicators
Source organization:
World Bank national accounts data, and OECD National Accounts data files.
Categories, topics:
Economy & Growth, Trade
Last updated:
apr 23, 2017
Indicators value changes by year
Minimum:
-20.089
jan 1, 2010
Maximum:
16.737
jan 1, 1970
At the date of observation
Value
Absolute change
Change from previous value
jan 1, 1962
5.142
+5.142
0.0%
jan 1, 1963
7.07
+1.928
37.5%
jan 1, 1964
2.189
-4.881
-69.04%
jan 1, 1965
5.81
+3.621
165.43%
jan 1, 1966
5.612
-0.198
-3.41%
jan 1, 1967
6.405
+0.793
14.13%
jan 1, 1968
5.95
-0.455
-7.11%
jan 1, 1969
9.982
+4.032
67.77%
jan 1, 1970
16.737
+6.755
67.67%
jan 1, 1971
8.812
-7.925
-47.35%
jan 1, 1972
-1.156
-9.967
-113.11%
jan 1, 1973
14.481
+15.636
-1.35K%
jan 1, 1974
7.221
-7.26
-50.14%
jan 1, 1975
0.111
-7.11
-98.47%
jan 1, 1976
-13.14
-13.251
-11.97K%
jan 1, 1977
14.396
+27.536
-209.56%
jan 1, 1978
16.043
+1.647
11.44%
jan 1, 1979
7.777
-8.265
-51.52%
jan 1, 1980
9.651
+1.873
24.09%
jan 1, 1981
8.1
-1.551
-16.07%
jan 1, 1982
5.801
-2.3
-28.39%
jan 1, 1983
-1.872
-7.673
-132.27%
jan 1, 1984
4.327
+6.199
-331.11%
jan 1, 1985
6.531
+2.204
50.95%
jan 1, 1986
0.633
-5.897
-90.3%
jan 1, 1987
2.564
+1.93
304.69%
jan 1, 1988
3.326
+0.763
29.74%
jan 1, 1989
3.526
+0.2
6.0%
jan 1, 1990
1.689
-1.837
-52.1%
jan 1, 1991
1.406
-0.283
-16.75%
jan 1, 1992
-7.893
-9.299
-661.36%
jan 1, 1993
10.377
+18.27
-231.47%
jan 1, 1994
16.667
+6.29
60.61%
jan 1, 1995
13.287
-3.38
-20.28%
jan 1, 1996
8.753
-4.534
-34.12%
jan 1, 1997
5.764
-2.989
-34.15%
jan 1, 1998
14.029
+8.266
143.4%
jan 1, 1999
8.874
-5.156
-36.75%
jan 1, 2000
11.336
+2.462
27.75%
jan 1, 2001
16.105
+4.769
42.08%
jan 1, 2002
1.323
-14.783
-91.79%
jan 1, 2003
3.669
+2.347
177.45%
jan 1, 2004
-1.211
-4.88
-133.0%
jan 1, 2005
8.656
+9.867
-814.92%
jan 1, 2006
6.9
-1.757
-20.29%
jan 1, 2007
10.129
+3.229
46.8%
jan 1, 2008
9.065
-1.064
-10.5%
jan 1, 2009
6.585
-2.481
-27.36%
jan 1, 2010
-20.089
-26.674
-405.1%
jan 1, 2011
6.179
+26.268
-130.76%
jan 1, 2012
1.986
-4.193
-67.86%
jan 1, 2013
1.24
-0.746
-37.57%
jan 1, 2014
1.118
-0.122
-9.86%
jan 1, 2015
-1.693
-2.81
-251.48%
jan 1, 2016
-0.159
+1.534
-90.62%
Ranking of countries by current statistics by years


Comments: