29
/
en
AIzaSyAYiBZKx7MnpbEhh9jyipgxe19OcubqV5w
April 1, 2024
38110
IDA blend
IDB
false
2
1
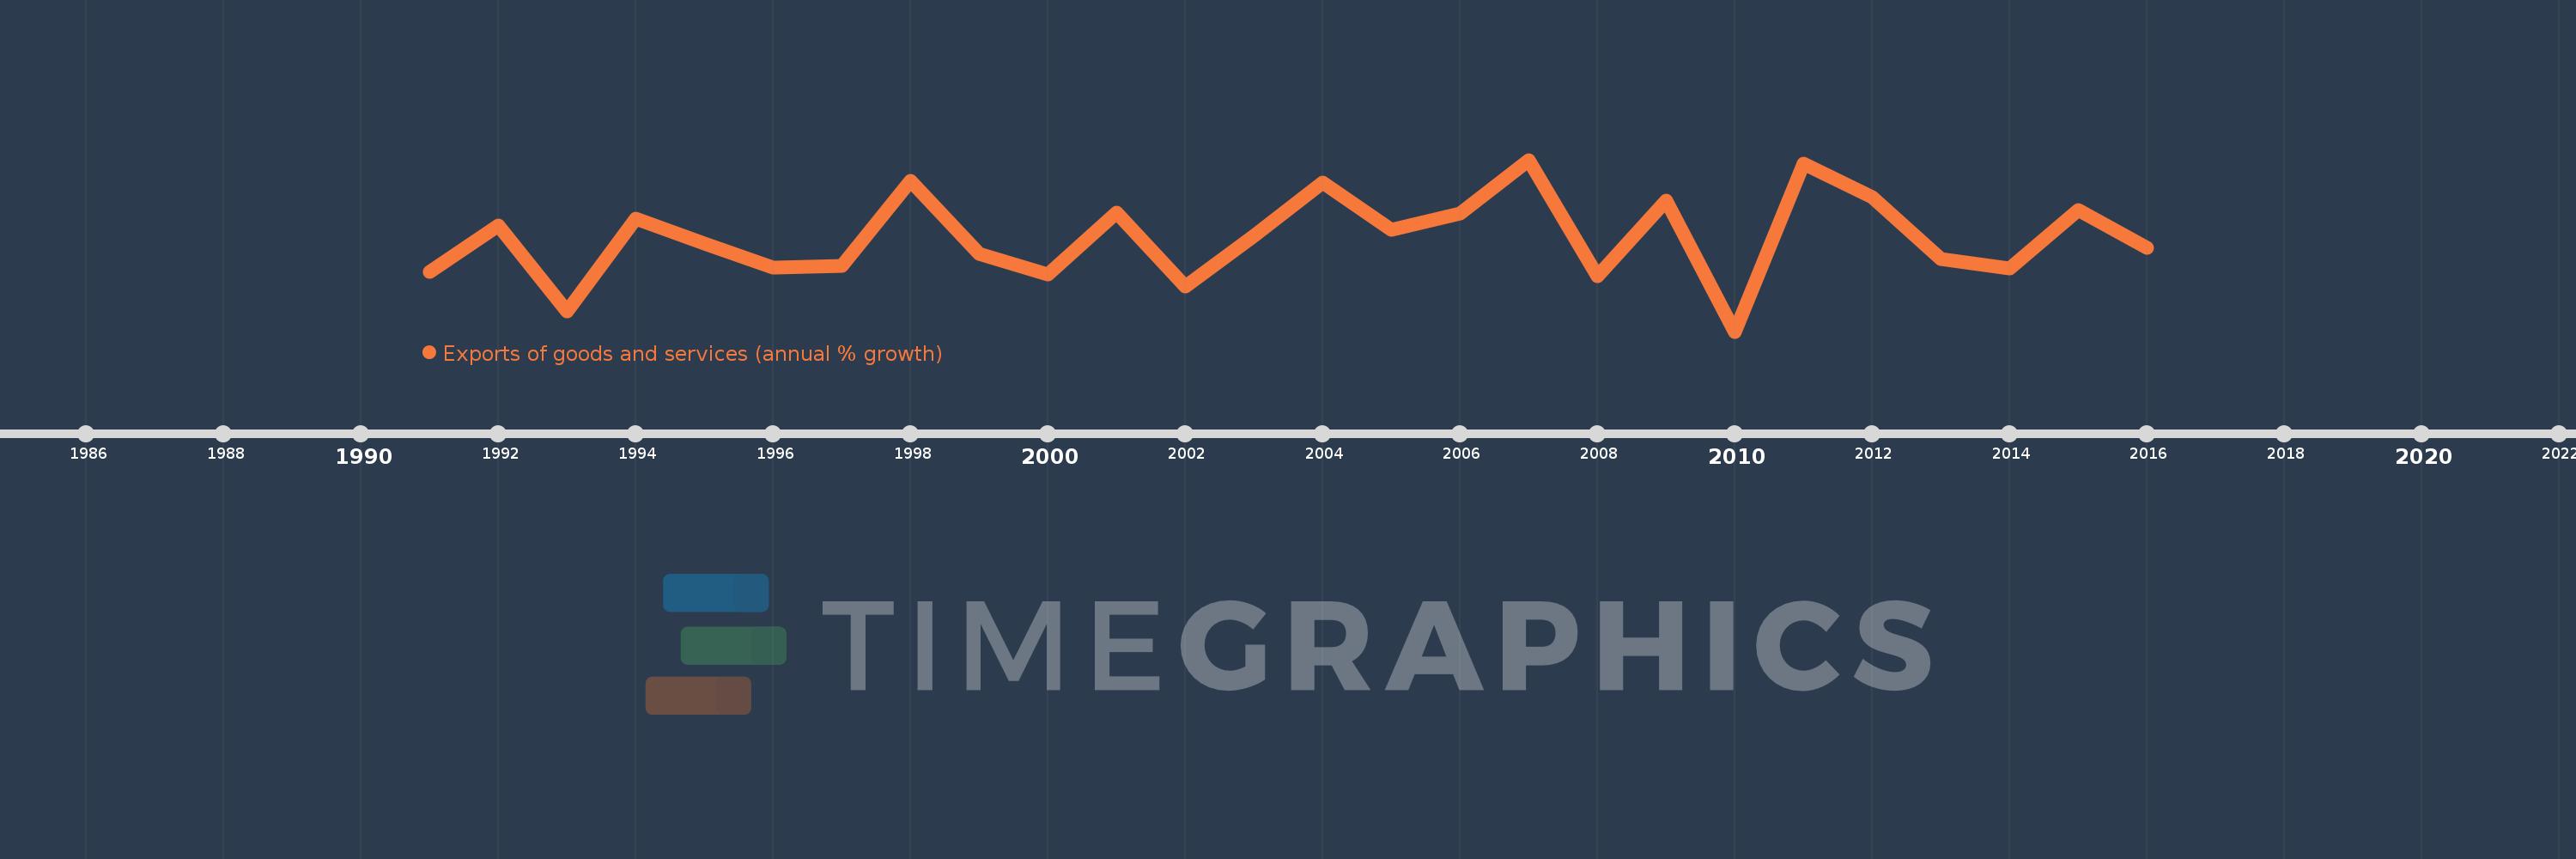
Exports of goods and services (annual % growth)
2016,2015,2014,2013,2012,2011,2010,2009,2008,2007,2006,2005,2004,2003,2002,2001,2000,1999,1998,1997,1996,1995,1994,1993,1992,1991
This statistics in other country:
AlbaniaAlgeriaAngolaAntigua and BarbudaArab WorldArgentinaArmeniaAustraliaAustriaAzerbaijanBahamas, TheBahrainBangladeshBarbadosBelarusBelgiumBelizeBeninBhutanBoliviaBosnia and HerzegovinaBotswanaBrazilBrunei DarussalamBulgariaBurkina FasoBurundiCabo VerdeCambodiaCameroonCanadaCaribbean small statesCentral Europe and the BalticsChadChileColombiaComorosCongo, Dem. Rep.Congo, Rep.Costa RicaCote d'IvoireCroatiaCubaCyprusCzech RepublicDenmarkDjiboutiDominican RepublicEarly-demographic dividendEast Asia & PacificEcuadorEgypt, Arab Rep.El SalvadorEquatorial GuineaEritreaEstoniaEthiopiaEuro areaEurope & Central AsiaEurope & Central Asia (excluding high income)Europe & Central Asia (IDA & IBRD countries)European UnionFijiFinlandFranceGabonGambia, TheGeorgiaGermanyGhanaGreeceGuatemalaGuineaGuinea-BissauHaitiHeavily indebted poor countries (HIPC)High incomeHondurasHong Kong SAR, ChinaHungaryIBRD onlyIcelandIDA & IBRD totalIDA blendIDA onlyIDA totalIndiaIndonesiaIran, Islamic Rep.IrelandIsraelItalyJamaicaJapanJordanKazakhstanKenyaKorea, Rep.KosovoKuwaitKyrgyz RepublicLao PDRLatin America & Caribbean Latin America & Caribbean (excluding high income)Latin America & the Caribbean (IDA & IBRD countries)LatviaLebanonLiberiaLibyaLithuaniaLow & middle incomeLow incomeLower middle incomeLuxembourgMacao SAR, ChinaMacedonia, FYRMadagascarMalawiMalaysiaMaliMaltaMauritaniaMauritiusMexicoMiddle East & North AfricaMiddle East & North Africa (excluding high income)Middle East & North Africa (IDA & IBRD countries)Middle incomeMoldovaMongoliaMontenegroMoroccoMozambiqueMyanmarNamibiaNepalNetherlandsNew ZealandNicaraguaNigerNigeriaNorth AmericaNorwayOECD membersOmanOther small statesPakistanPanamaPapua New GuineaParaguayPeruPhilippinesPolandPortugalPost-demographic dividendPre-demographic dividendPuerto RicoQatarRomaniaRussian FederationRwandaSamoaSaudi ArabiaSenegalSerbiaSeychellesSierra LeoneSingaporeSlovak RepublicSloveniaSmall statesSomaliaSouth AfricaSouth AsiaSouth Asia (IDA & IBRD)South SudanSpainSri LankaSub-Saharan Africa Sub-Saharan Africa (excluding high income)Sub-Saharan Africa (IDA & IBRD countries)SudanSurinameSwazilandSwedenSwitzerlandSyrian Arab RepublicTajikistanTanzaniaThailandTimor-LesteTogoTrinidad and TobagoTunisiaTurkeyTurkmenistanUgandaUkraineUnited Arab EmiratesUnited KingdomUnited StatesUruguayUzbekistanVanuatuVenezuela, RBVietnamWest Bank and GazaWorldZambiaZimbabwe Timeline:
This timeline shows a graph from 1991 to 2016 of IDA blend. No data until 1990. Number of actual observations by date: 26.
Source name:
World Development Indicators
Source organization:
World Bank national accounts data, and OECD National Accounts data files.
Categories, topics:
Economy & Growth, Trade
Last updated:
apr 23, 2017
Indicators value changes by year
Minimum:
-14.214
jan 1, 2010
Maximum:
24.505
jan 1, 2007
At the date of observation
Value
Absolute change
Change from previous value
jan 1, 1991
-0.789
-0.789
0.0%
jan 1, 1992
9.686
+10.474
-1.33K%
jan 1, 1993
-9.637
-19.323
-199.5%
jan 1, 1994
11.191
+20.828
-216.13%
jan 1, 1995
5.621
-5.57
-49.78%
jan 1, 1996
0.24
-5.38
-95.72%
jan 1, 1997
0.531
+0.29
120.88%
jan 1, 1998
19.811
+19.281
3.63K%
jan 1, 1999
3.211
-16.601
-83.79%
jan 1, 2000
-1.416
-4.627
-144.11%
jan 1, 2001
12.627
+14.044
-991.51%
jan 1, 2002
-3.988
-16.615
-131.58%
jan 1, 2003
7.377
+11.364
-284.98%
jan 1, 2004
19.416
+12.039
163.21%
jan 1, 2005
8.761
-10.655
-54.88%
jan 1, 2006
12.382
+3.62
41.32%
jan 1, 2007
24.505
+12.123
97.91%
jan 1, 2008
-1.715
-26.22
-107.0%
jan 1, 2009
15.223
+16.939
-987.41%
jan 1, 2010
-14.214
-29.437
-193.37%
jan 1, 2011
23.554
+37.768
-265.71%
jan 1, 2012
16.016
-7.537
-32.0%
jan 1, 2013
2.208
-13.809
-86.22%
jan 1, 2014
-0.016
-2.224
-100.73%
jan 1, 2015
13.123
+13.139
-81.73K%
jan 1, 2016
4.574
-8.549
-65.14%
Ranking of countries by current statistics by years


Comments: