29
/
en
AIzaSyAYiBZKx7MnpbEhh9jyipgxe19OcubqV5w
April 1, 2024
118855
Denmark
DNK
true
2
1
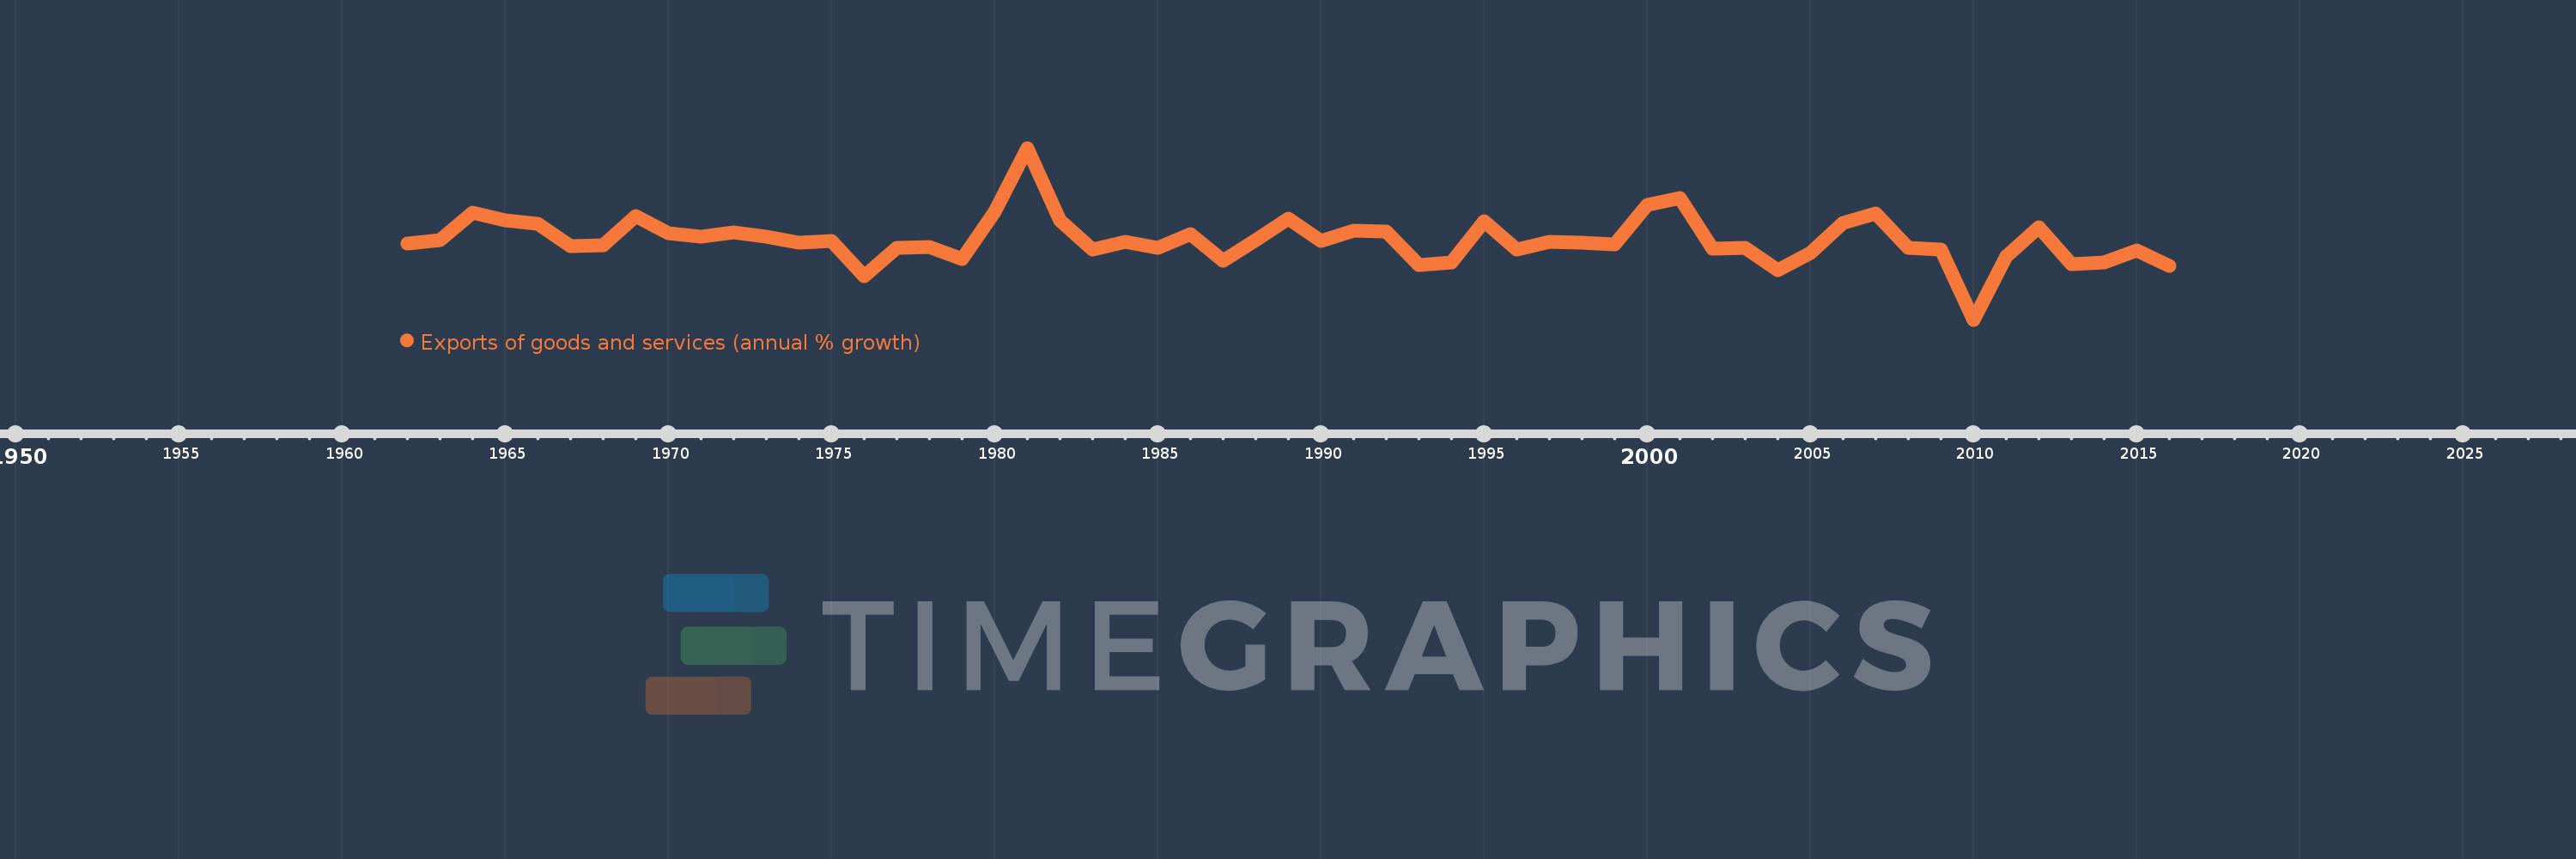
Exports of goods and services (annual % growth)
2016,2015,2014,2013,2012,2011,2010,2009,2008,2007,2006,2005,2004,2003,2002,2001,2000,1999,1998,1997,1996,1995,1994,1993,1992,1991,1990,1989,1988,1987,1986,1985,1984,1983,1982,1981,1980,1979,1978,1977,1976,1975,1974,1973,1972,1971,1970,1969,1968,1967,1966,1965,1964,1963,1962
This statistics in other country:
AlbaniaAlgeriaAngolaAntigua and BarbudaArab WorldArgentinaArmeniaAustraliaAustriaAzerbaijanBahamas, TheBahrainBangladeshBarbadosBelarusBelgiumBelizeBeninBhutanBoliviaBosnia and HerzegovinaBotswanaBrazilBrunei DarussalamBulgariaBurkina FasoBurundiCabo VerdeCambodiaCameroonCanadaCaribbean small statesCentral Europe and the BalticsChadChileColombiaComorosCongo, Dem. Rep.Congo, Rep.Costa RicaCote d'IvoireCroatiaCubaCyprusCzech RepublicDenmarkDjiboutiDominican RepublicEarly-demographic dividendEast Asia & PacificEcuadorEgypt, Arab Rep.El SalvadorEquatorial GuineaEritreaEstoniaEthiopiaEuro areaEurope & Central AsiaEurope & Central Asia (excluding high income)Europe & Central Asia (IDA & IBRD countries)European UnionFijiFinlandFranceGabonGambia, TheGeorgiaGermanyGhanaGreeceGuatemalaGuineaGuinea-BissauHaitiHeavily indebted poor countries (HIPC)High incomeHondurasHong Kong SAR, ChinaHungaryIBRD onlyIcelandIDA & IBRD totalIDA blendIDA onlyIDA totalIndiaIndonesiaIran, Islamic Rep.IrelandIsraelItalyJamaicaJapanJordanKazakhstanKenyaKorea, Rep.KosovoKuwaitKyrgyz RepublicLao PDRLatin America & Caribbean Latin America & Caribbean (excluding high income)Latin America & the Caribbean (IDA & IBRD countries)LatviaLebanonLiberiaLibyaLithuaniaLow & middle incomeLow incomeLower middle incomeLuxembourgMacao SAR, ChinaMacedonia, FYRMadagascarMalawiMalaysiaMaliMaltaMauritaniaMauritiusMexicoMiddle East & North AfricaMiddle East & North Africa (excluding high income)Middle East & North Africa (IDA & IBRD countries)Middle incomeMoldovaMongoliaMontenegroMoroccoMozambiqueMyanmarNamibiaNepalNetherlandsNew ZealandNicaraguaNigerNigeriaNorth AmericaNorwayOECD membersOmanOther small statesPakistanPanamaPapua New GuineaParaguayPeruPhilippinesPolandPortugalPost-demographic dividendPre-demographic dividendPuerto RicoQatarRomaniaRussian FederationRwandaSamoaSaudi ArabiaSenegalSerbiaSeychellesSierra LeoneSingaporeSlovak RepublicSloveniaSmall statesSomaliaSouth AfricaSouth AsiaSouth Asia (IDA & IBRD)South SudanSpainSri LankaSub-Saharan Africa Sub-Saharan Africa (excluding high income)Sub-Saharan Africa (IDA & IBRD countries)SudanSurinameSwazilandSwedenSwitzerlandSyrian Arab RepublicTajikistanTanzaniaThailandTimor-LesteTogoTrinidad and TobagoTunisiaTurkeyTurkmenistanUgandaUkraineUnited Arab EmiratesUnited KingdomUnited StatesUruguayUzbekistanVanuatuVenezuela, RBVietnamWest Bank and GazaWorldZambiaZimbabwe Timeline:
This timeline shows a graph from 1962 to 2016 of Denmark. No data until 1961. Number of actual observations by date: 55.
Source name:
World Development Indicators
Source organization:
World Bank national accounts data, and OECD National Accounts data files.
Categories, topics:
Economy & Growth, Trade
Last updated:
apr 23, 2017
Indicators value changes by year
Minimum:
-9.492
jan 1, 2010
At the date of observation
Value
Absolute change
Change from previous value
jan 1, 1962
4.276
+4.276
0.0%
jan 1, 1963
4.911
+0.635
14.84%
jan 1, 1964
9.977
+5.066
103.15%
jan 1, 1965
8.542
-1.435
-14.38%
jan 1, 1966
7.882
-0.66
-7.72%
jan 1, 1967
3.896
-3.986
-50.57%
jan 1, 1968
3.952
+0.056
1.43%
jan 1, 1969
9.254
+5.302
134.16%
jan 1, 1970
6.169
-3.085
-33.34%
jan 1, 1971
5.602
-0.567
-9.2%
jan 1, 1972
6.421
+0.819
14.62%
jan 1, 1973
5.517
-0.904
-14.08%
jan 1, 1974
4.469
-1.048
-19.0%
jan 1, 1975
4.77
+0.301
6.74%
jan 1, 1976
-1.57
-6.34
-132.92%
jan 1, 1977
3.545
+5.116
-325.79%
jan 1, 1978
3.64
+0.094
2.66%
jan 1, 1979
1.466
-2.174
-59.73%
jan 1, 1980
10.15
+8.684
592.46%
jan 1, 1981
21.68
+11.531
113.61%
jan 1, 1982
8.547
-13.133
-60.58%
jan 1, 1983
3.184
-5.363
-62.75%
jan 1, 1984
4.64
+1.457
45.75%
jan 1, 1985
3.543
-1.097
-23.64%
jan 1, 1986
6.003
+2.46
69.43%
jan 1, 1987
1.26
-4.743
-79.01%
jan 1, 1988
4.887
+3.627
287.82%
jan 1, 1989
8.777
+3.891
79.62%
jan 1, 1990
4.74
-4.038
-46.0%
jan 1, 1991
6.747
+2.007
42.36%
jan 1, 1992
6.489
-0.258
-3.83%
jan 1, 1993
0.496
-5.993
-92.36%
jan 1, 1994
0.977
+0.482
97.23%
jan 1, 1995
8.406
+7.428
760.07%
jan 1, 1996
3.229
-5.177
-61.59%
jan 1, 1997
4.65
+1.421
44.02%
jan 1, 1998
4.488
-0.163
-3.5%
jan 1, 1999
4.101
-0.386
-8.61%
jan 1, 2000
11.27
+7.168
174.77%
jan 1, 2001
12.578
+1.308
11.61%
jan 1, 2002
3.353
-9.225
-73.34%
jan 1, 2003
3.631
+0.278
8.29%
jan 1, 2004
-0.45
-4.08
-112.38%
jan 1, 2005
2.637
+3.087
-686.72%
jan 1, 2006
8.139
+5.501
208.59%
jan 1, 2007
9.795
+1.656
20.35%
jan 1, 2008
3.567
-6.228
-63.59%
jan 1, 2009
3.195
-0.372
-10.42%
jan 1, 2010
-9.492
-12.687
-397.09%
jan 1, 2011
1.922
+11.413
-120.24%
jan 1, 2012
7.269
+5.348
278.31%
jan 1, 2013
0.571
-6.698
-92.14%
jan 1, 2014
0.878
+0.307
53.76%
jan 1, 2015
3.05
+2.172
247.4%
jan 1, 2016
0.299
-2.751
-90.19%
Ranking of countries by current statistics by years


Comments: