29
/
en
AIzaSyAYiBZKx7MnpbEhh9jyipgxe19OcubqV5w
April 1, 2024
131925
Fiji
FJI
true
2
1
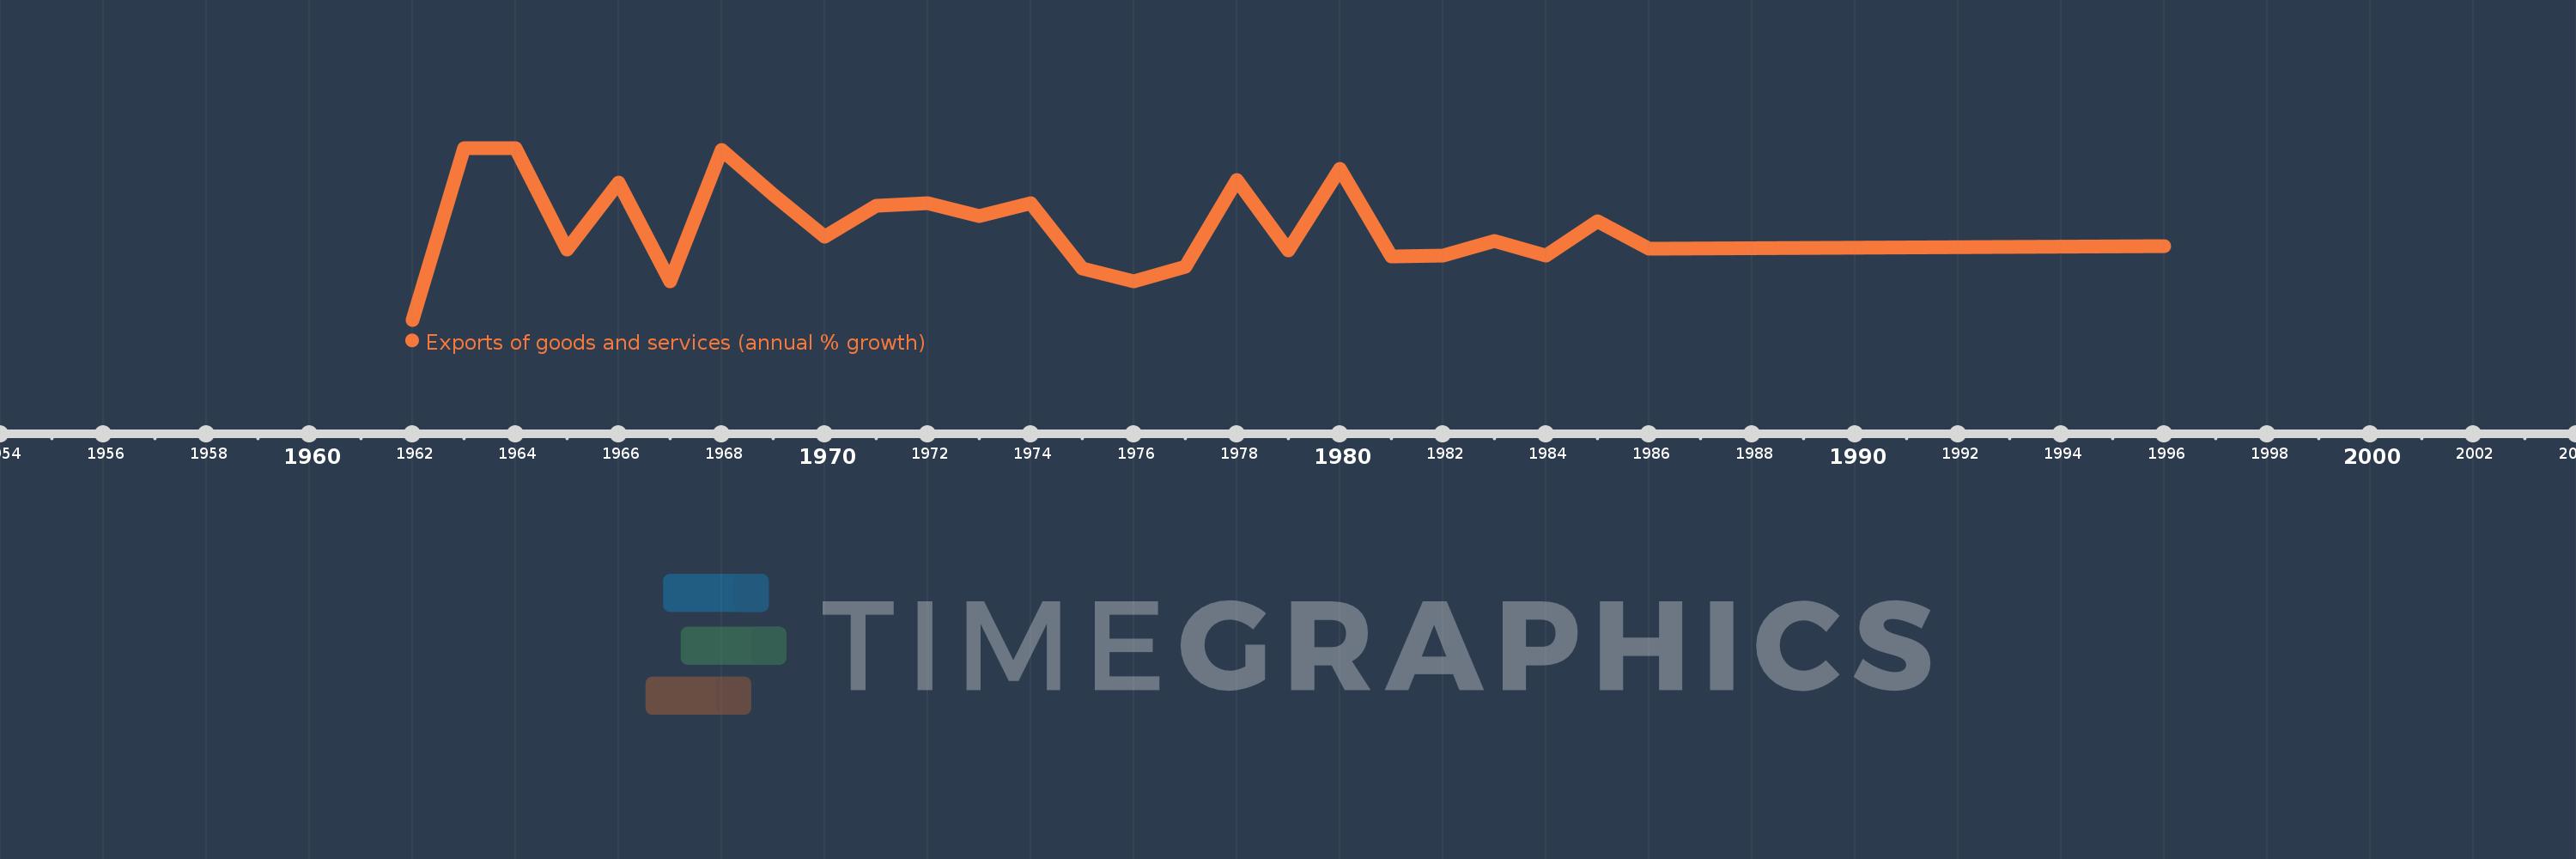
Exports of goods and services (annual % growth)
1996,1986,1985,1984,1983,1982,1981,1980,1979,1978,1977,1976,1975,1974,1973,1972,1971,1970,1969,1968,1967,1966,1965,1964,1963,1962
This statistics in other country:
AlbaniaAlgeriaAngolaAntigua and BarbudaArab WorldArgentinaArmeniaAustraliaAustriaAzerbaijanBahamas, TheBahrainBangladeshBarbadosBelarusBelgiumBelizeBeninBhutanBoliviaBosnia and HerzegovinaBotswanaBrazilBrunei DarussalamBulgariaBurkina FasoBurundiCabo VerdeCambodiaCameroonCanadaCaribbean small statesCentral Europe and the BalticsChadChileColombiaComorosCongo, Dem. Rep.Congo, Rep.Costa RicaCote d'IvoireCroatiaCubaCyprusCzech RepublicDenmarkDjiboutiDominican RepublicEarly-demographic dividendEast Asia & PacificEcuadorEgypt, Arab Rep.El SalvadorEquatorial GuineaEritreaEstoniaEthiopiaEuro areaEurope & Central AsiaEurope & Central Asia (excluding high income)Europe & Central Asia (IDA & IBRD countries)European UnionFijiFinlandFranceGabonGambia, TheGeorgiaGermanyGhanaGreeceGuatemalaGuineaGuinea-BissauHaitiHeavily indebted poor countries (HIPC)High incomeHondurasHong Kong SAR, ChinaHungaryIBRD onlyIcelandIDA & IBRD totalIDA blendIDA onlyIDA totalIndiaIndonesiaIran, Islamic Rep.IrelandIsraelItalyJamaicaJapanJordanKazakhstanKenyaKorea, Rep.KosovoKuwaitKyrgyz RepublicLao PDRLatin America & Caribbean Latin America & Caribbean (excluding high income)Latin America & the Caribbean (IDA & IBRD countries)LatviaLebanonLiberiaLibyaLithuaniaLow & middle incomeLow incomeLower middle incomeLuxembourgMacao SAR, ChinaMacedonia, FYRMadagascarMalawiMalaysiaMaliMaltaMauritaniaMauritiusMexicoMiddle East & North AfricaMiddle East & North Africa (excluding high income)Middle East & North Africa (IDA & IBRD countries)Middle incomeMoldovaMongoliaMontenegroMoroccoMozambiqueMyanmarNamibiaNepalNetherlandsNew ZealandNicaraguaNigerNigeriaNorth AmericaNorwayOECD membersOmanOther small statesPakistanPanamaPapua New GuineaParaguayPeruPhilippinesPolandPortugalPost-demographic dividendPre-demographic dividendPuerto RicoQatarRomaniaRussian FederationRwandaSamoaSaudi ArabiaSenegalSerbiaSeychellesSierra LeoneSingaporeSlovak RepublicSloveniaSmall statesSomaliaSouth AfricaSouth AsiaSouth Asia (IDA & IBRD)South SudanSpainSri LankaSub-Saharan Africa Sub-Saharan Africa (excluding high income)Sub-Saharan Africa (IDA & IBRD countries)SudanSurinameSwazilandSwedenSwitzerlandSyrian Arab RepublicTajikistanTanzaniaThailandTimor-LesteTogoTrinidad and TobagoTunisiaTurkeyTurkmenistanUgandaUkraineUnited Arab EmiratesUnited KingdomUnited StatesUruguayUzbekistanVanuatuVenezuela, RBVietnamWest Bank and GazaWorldZambiaZimbabwe Timeline:
This timeline shows a graph from 1962 to 1996 of Fiji. No data until 1961. Number of actual observations by date: 26.
Source name:
World Development Indicators
Source organization:
World Bank national accounts data, and OECD National Accounts data files.
Categories, topics:
Economy & Growth, Trade
Last updated:
apr 23, 2017
Indicators value changes by year
Minimum:
-17.767
jan 1, 1962
Maximum:
24.811
jan 1, 1964
At the date of observation
Value
Absolute change
Change from previous value
jan 1, 1962
-17.767
-17.767
0.0%
jan 1, 1963
24.675
+42.442
-238.88%
jan 1, 1964
24.811
+0.135
0.55%
jan 1, 1965
-0.379
-25.19
-101.53%
jan 1, 1966
16.299
+16.678
-4.4K%
jan 1, 1967
-8.251
-24.55
-150.63%
jan 1, 1968
24.268
+32.52
-394.11%
jan 1, 1969
13.268
-11.0
-45.33%
jan 1, 1970
2.89
-10.378
-78.22%
jan 1, 1971
10.399
+7.509
259.78%
jan 1, 1972
11.205
+0.806
7.75%
jan 1, 1973
8.029
-3.176
-28.35%
jan 1, 1974
11.223
+3.194
39.78%
jan 1, 1975
-5.145
-16.368
-145.85%
jan 1, 1976
-8.348
-3.203
62.24%
jan 1, 1977
-4.689
+3.659
-43.83%
jan 1, 1978
16.895
+21.584
-460.34%
jan 1, 1979
-0.586
-17.481
-103.47%
jan 1, 1980
19.674
+20.26
-3.46K%
jan 1, 1981
-2.088
-21.761
-110.61%
jan 1, 1982
-1.806
+0.281
-13.48%
jan 1, 1983
1.839
+3.646
-201.84%
jan 1, 1984
-1.806
-3.646
-198.19%
jan 1, 1985
6.695
+8.501
-470.64%
jan 1, 1986
-0.198
-6.893
-102.95%
jan 1, 1996
0.534
+0.732
-370.17%
Ranking of countries by current statistics by years


Comments: