29
/
en
AIzaSyAYiBZKx7MnpbEhh9jyipgxe19OcubqV5w
April 1, 2024
104808
Chile
CHL
true
2
1
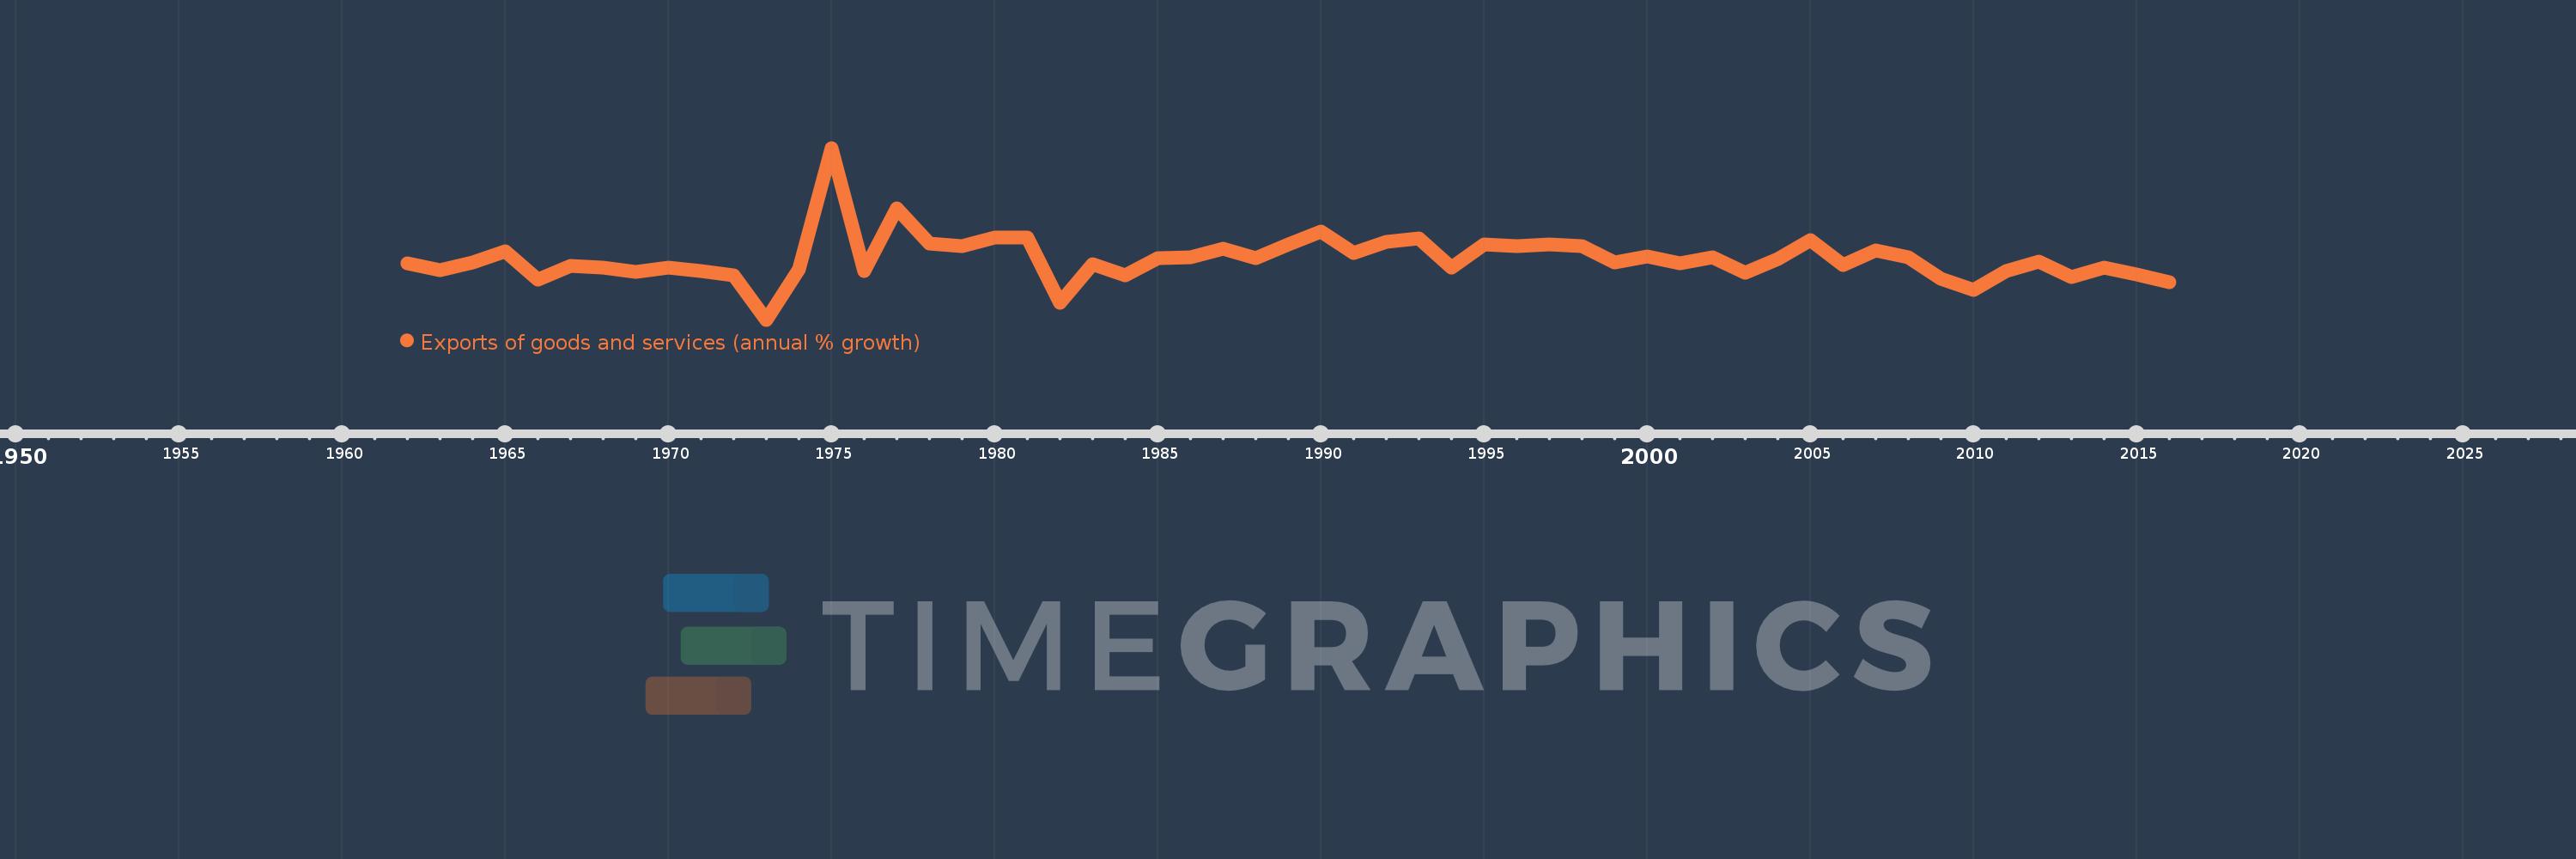
Exports of goods and services (annual % growth)
2016,2015,2014,2013,2012,2011,2010,2009,2008,2007,2006,2005,2004,2003,2002,2001,2000,1999,1998,1997,1996,1995,1994,1993,1992,1991,1990,1989,1988,1987,1986,1985,1984,1983,1982,1981,1980,1979,1978,1977,1976,1975,1974,1973,1972,1971,1970,1969,1968,1967,1966,1965,1964,1963,1962
This statistics in other country:
AlbaniaAlgeriaAngolaAntigua and BarbudaArab WorldArgentinaArmeniaAustraliaAustriaAzerbaijanBahamas, TheBahrainBangladeshBarbadosBelarusBelgiumBelizeBeninBhutanBoliviaBosnia and HerzegovinaBotswanaBrazilBrunei DarussalamBulgariaBurkina FasoBurundiCabo VerdeCambodiaCameroonCanadaCaribbean small statesCentral Europe and the BalticsChadChileColombiaComorosCongo, Dem. Rep.Congo, Rep.Costa RicaCote d'IvoireCroatiaCubaCyprusCzech RepublicDenmarkDjiboutiDominican RepublicEarly-demographic dividendEast Asia & PacificEcuadorEgypt, Arab Rep.El SalvadorEquatorial GuineaEritreaEstoniaEthiopiaEuro areaEurope & Central AsiaEurope & Central Asia (excluding high income)Europe & Central Asia (IDA & IBRD countries)European UnionFijiFinlandFranceGabonGambia, TheGeorgiaGermanyGhanaGreeceGuatemalaGuineaGuinea-BissauHaitiHeavily indebted poor countries (HIPC)High incomeHondurasHong Kong SAR, ChinaHungaryIBRD onlyIcelandIDA & IBRD totalIDA blendIDA onlyIDA totalIndiaIndonesiaIran, Islamic Rep.IrelandIsraelItalyJamaicaJapanJordanKazakhstanKenyaKorea, Rep.KosovoKuwaitKyrgyz RepublicLao PDRLatin America & Caribbean Latin America & Caribbean (excluding high income)Latin America & the Caribbean (IDA & IBRD countries)LatviaLebanonLiberiaLibyaLithuaniaLow & middle incomeLow incomeLower middle incomeLuxembourgMacao SAR, ChinaMacedonia, FYRMadagascarMalawiMalaysiaMaliMaltaMauritaniaMauritiusMexicoMiddle East & North AfricaMiddle East & North Africa (excluding high income)Middle East & North Africa (IDA & IBRD countries)Middle incomeMoldovaMongoliaMontenegroMoroccoMozambiqueMyanmarNamibiaNepalNetherlandsNew ZealandNicaraguaNigerNigeriaNorth AmericaNorwayOECD membersOmanOther small statesPakistanPanamaPapua New GuineaParaguayPeruPhilippinesPolandPortugalPost-demographic dividendPre-demographic dividendPuerto RicoQatarRomaniaRussian FederationRwandaSamoaSaudi ArabiaSenegalSerbiaSeychellesSierra LeoneSingaporeSlovak RepublicSloveniaSmall statesSomaliaSouth AfricaSouth AsiaSouth Asia (IDA & IBRD)South SudanSpainSri LankaSub-Saharan Africa Sub-Saharan Africa (excluding high income)Sub-Saharan Africa (IDA & IBRD countries)SudanSurinameSwazilandSwedenSwitzerlandSyrian Arab RepublicTajikistanTanzaniaThailandTimor-LesteTogoTrinidad and TobagoTunisiaTurkeyTurkmenistanUgandaUkraineUnited Arab EmiratesUnited KingdomUnited StatesUruguayUzbekistanVanuatuVenezuela, RBVietnamWest Bank and GazaWorldZambiaZimbabwe Timeline:
This timeline shows a graph from 1962 to 2016 of Chile. No data until 1961. Number of actual observations by date: 55.
Source name:
World Development Indicators
Source organization:
World Bank national accounts data, and OECD National Accounts data files.
Categories, topics:
Economy & Growth, Trade
Last updated:
apr 23, 2017
Indicators value changes by year
Minimum:
-15.111
jan 1, 1973
Maximum:
45.951
jan 1, 1975
At the date of observation
Value
Absolute change
Change from previous value
jan 1, 1962
4.943
+4.943
0.0%
jan 1, 1963
2.61
-2.333
-47.19%
jan 1, 1964
5.278
+2.668
102.22%
jan 1, 1965
9.231
+3.953
74.89%
jan 1, 1966
-0.853
-10.083
-109.24%
jan 1, 1967
4.008
+4.861
-570.14%
jan 1, 1968
3.271
-0.737
-18.4%
jan 1, 1969
2.03
-1.24
-37.93%
jan 1, 1970
3.55
+1.52
74.85%
jan 1, 1971
2.063
-1.486
-41.87%
jan 1, 1972
0.823
-1.241
-60.13%
jan 1, 1973
-15.111
-15.934
-1.94K%
jan 1, 1974
2.79
+17.902
-118.47%
jan 1, 1975
45.951
+43.16
1.55K%
jan 1, 1976
2.35
-43.601
-94.89%
jan 1, 1977
24.369
+22.019
937.18%
jan 1, 1978
11.88
-12.488
-51.25%
jan 1, 1979
11.19
-0.69
-5.81%
jan 1, 1980
14.144
+2.954
26.4%
jan 1, 1981
14.194
+0.05
0.35%
jan 1, 1982
-8.95
-23.144
-163.06%
jan 1, 1983
4.716
+13.666
-152.69%
jan 1, 1984
0.717
-3.999
-84.8%
jan 1, 1985
6.704
+5.987
835.05%
jan 1, 1986
6.965
+0.26
3.88%
jan 1, 1987
10.095
+3.131
44.95%
jan 1, 1988
6.741
-3.355
-33.23%
jan 1, 1989
11.555
+4.815
71.42%
jan 1, 1990
16.111
+4.556
39.42%
jan 1, 1991
8.617
-7.494
-46.51%
jan 1, 1992
12.434
+3.817
44.29%
jan 1, 1993
13.926
+1.493
12.01%
jan 1, 1994
3.534
-10.392
-74.62%
jan 1, 1995
11.628
+8.093
229.0%
jan 1, 1996
10.984
-0.644
-5.54%
jan 1, 1997
11.785
+0.801
7.3%
jan 1, 1998
11.2
-0.585
-4.96%
jan 1, 1999
5.231
-5.969
-53.3%
jan 1, 2000
7.321
+2.09
39.96%
jan 1, 2001
5.076
-2.245
-30.67%
jan 1, 2002
7.232
+2.156
42.47%
jan 1, 2003
1.604
-5.628
-77.82%
jan 1, 2004
6.462
+4.858
302.91%
jan 1, 2005
13.3
+6.838
105.81%
jan 1, 2006
4.317
-8.983
-67.54%
jan 1, 2007
9.513
+5.196
120.35%
jan 1, 2008
7.19
-2.323
-24.42%
jan 1, 2009
-0.7
-7.89
-109.73%
jan 1, 2010
-4.55
-3.85
550.06%
jan 1, 2011
2.324
+6.874
-151.09%
jan 1, 2012
5.516
+3.192
137.32%
jan 1, 2013
0.114
-5.403
-97.94%
jan 1, 2014
3.295
+3.181
2.8K%
jan 1, 2015
1.052
-2.243
-68.07%
jan 1, 2016
-1.885
-2.937
-279.17%
Ranking of countries by current statistics by years


Comments: