29
/
en
AIzaSyAYiBZKx7MnpbEhh9jyipgxe19OcubqV5w
April 1, 2024
76107
Bahamas, The
BHS
true
2
1
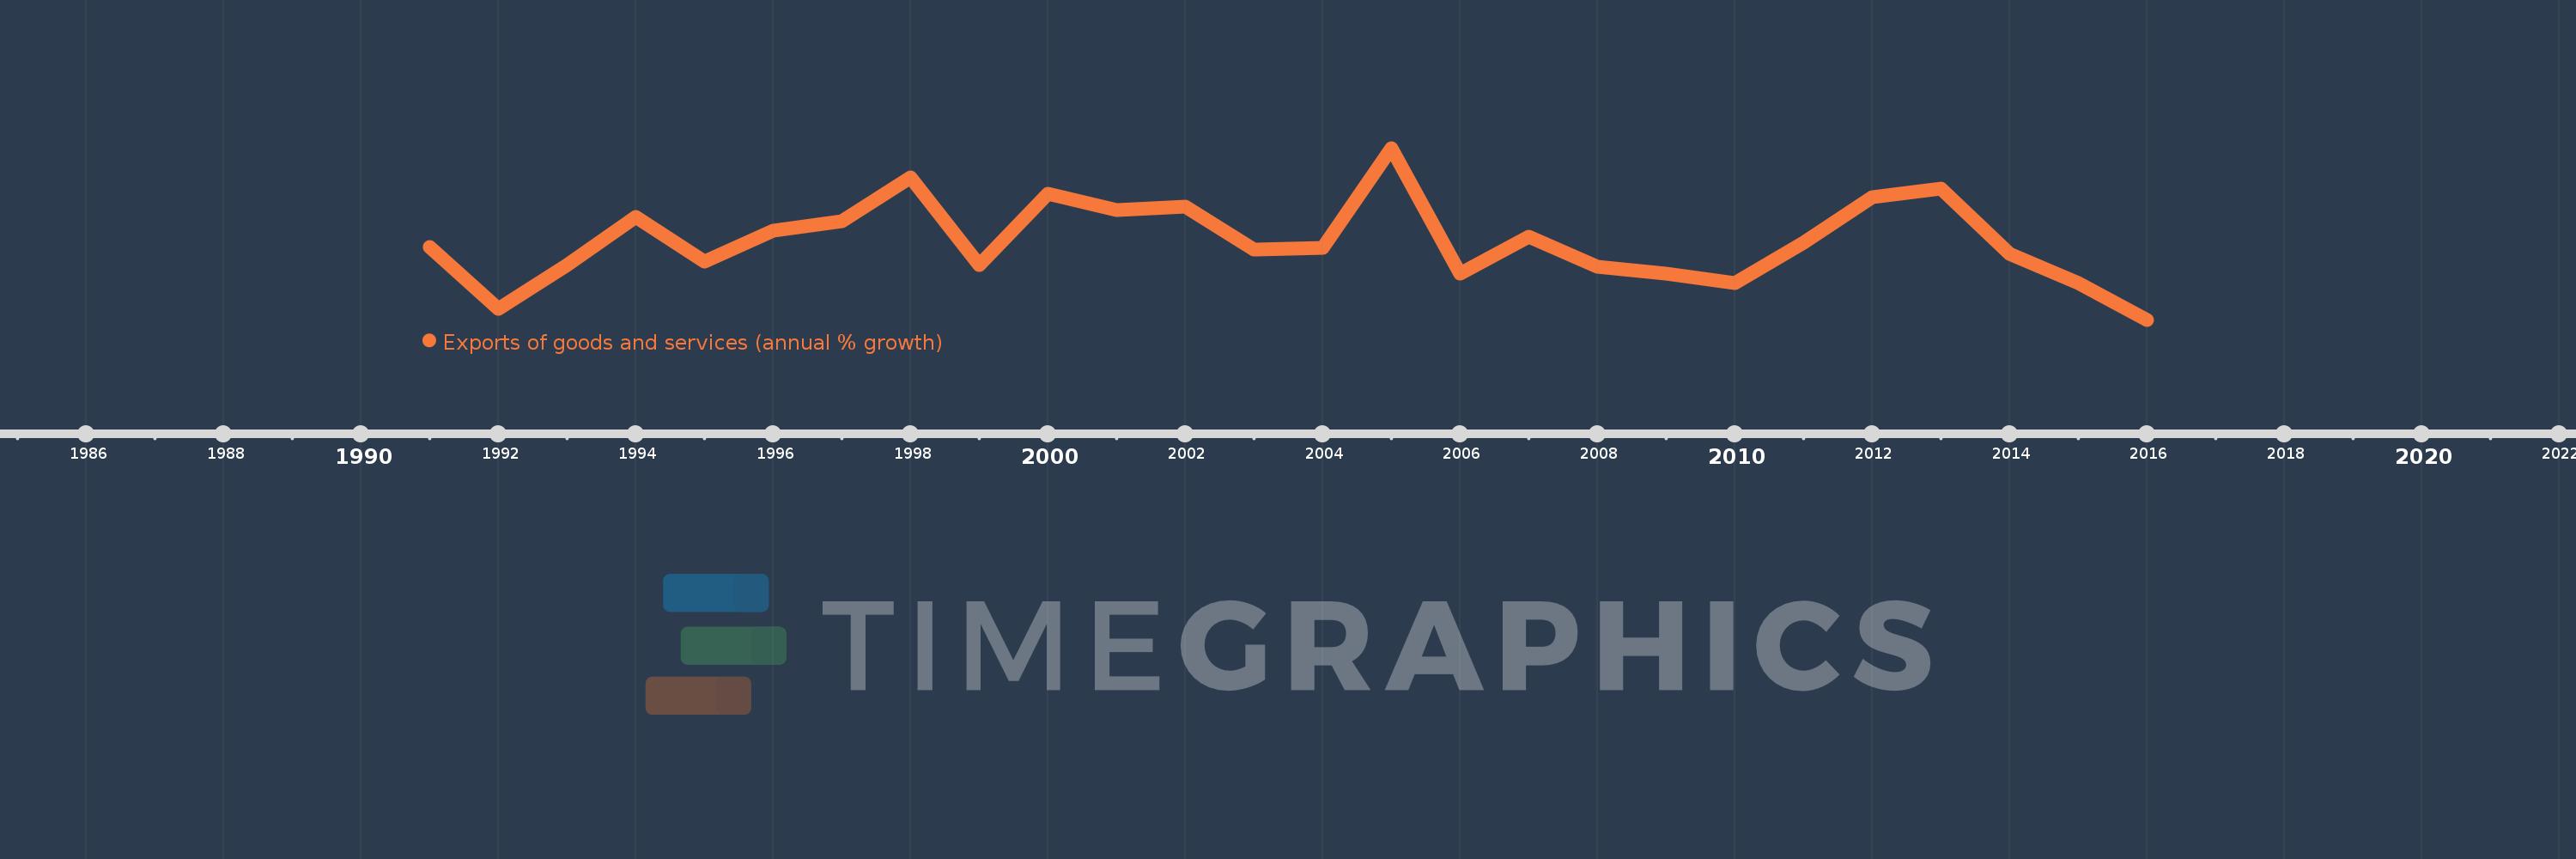
Exports of goods and services (annual % growth)
2016,2015,2014,2013,2012,2011,2010,2009,2008,2007,2006,2005,2004,2003,2002,2001,2000,1999,1998,1997,1996,1995,1994,1993,1992,1991
This statistics in other country:
AlbaniaAlgeriaAngolaAntigua and BarbudaArab WorldArgentinaArmeniaAustraliaAustriaAzerbaijanBahamas, TheBahrainBangladeshBarbadosBelarusBelgiumBelizeBeninBhutanBoliviaBosnia and HerzegovinaBotswanaBrazilBrunei DarussalamBulgariaBurkina FasoBurundiCabo VerdeCambodiaCameroonCanadaCaribbean small statesCentral Europe and the BalticsChadChileColombiaComorosCongo, Dem. Rep.Congo, Rep.Costa RicaCote d'IvoireCroatiaCubaCyprusCzech RepublicDenmarkDjiboutiDominican RepublicEarly-demographic dividendEast Asia & PacificEcuadorEgypt, Arab Rep.El SalvadorEquatorial GuineaEritreaEstoniaEthiopiaEuro areaEurope & Central AsiaEurope & Central Asia (excluding high income)Europe & Central Asia (IDA & IBRD countries)European UnionFijiFinlandFranceGabonGambia, TheGeorgiaGermanyGhanaGreeceGuatemalaGuineaGuinea-BissauHaitiHeavily indebted poor countries (HIPC)High incomeHondurasHong Kong SAR, ChinaHungaryIBRD onlyIcelandIDA & IBRD totalIDA blendIDA onlyIDA totalIndiaIndonesiaIran, Islamic Rep.IrelandIsraelItalyJamaicaJapanJordanKazakhstanKenyaKorea, Rep.KosovoKuwaitKyrgyz RepublicLao PDRLatin America & Caribbean Latin America & Caribbean (excluding high income)Latin America & the Caribbean (IDA & IBRD countries)LatviaLebanonLiberiaLibyaLithuaniaLow & middle incomeLow incomeLower middle incomeLuxembourgMacao SAR, ChinaMacedonia, FYRMadagascarMalawiMalaysiaMaliMaltaMauritaniaMauritiusMexicoMiddle East & North AfricaMiddle East & North Africa (excluding high income)Middle East & North Africa (IDA & IBRD countries)Middle incomeMoldovaMongoliaMontenegroMoroccoMozambiqueMyanmarNamibiaNepalNetherlandsNew ZealandNicaraguaNigerNigeriaNorth AmericaNorwayOECD membersOmanOther small statesPakistanPanamaPapua New GuineaParaguayPeruPhilippinesPolandPortugalPost-demographic dividendPre-demographic dividendPuerto RicoQatarRomaniaRussian FederationRwandaSamoaSaudi ArabiaSenegalSerbiaSeychellesSierra LeoneSingaporeSlovak RepublicSloveniaSmall statesSomaliaSouth AfricaSouth AsiaSouth Asia (IDA & IBRD)South SudanSpainSri LankaSub-Saharan Africa Sub-Saharan Africa (excluding high income)Sub-Saharan Africa (IDA & IBRD countries)SudanSurinameSwazilandSwedenSwitzerlandSyrian Arab RepublicTajikistanTanzaniaThailandTimor-LesteTogoTrinidad and TobagoTunisiaTurkeyTurkmenistanUgandaUkraineUnited Arab EmiratesUnited KingdomUnited StatesUruguayUzbekistanVanuatuVenezuela, RBVietnamWest Bank and GazaWorldZambiaZimbabwe Timeline:
This timeline shows a graph from 1991 to 2016 of Bahamas, The. No data until 1990. Number of actual observations by date: 26.
Source name:
World Development Indicators
Source organization:
World Bank national accounts data, and OECD National Accounts data files.
Categories, topics:
Economy & Growth, Trade
Last updated:
apr 23, 2017
Indicators value changes by year
Minimum:
-7.249
jan 1, 2016
Maximum:
11.697
jan 1, 2005
At the date of observation
Value
Absolute change
Change from previous value
jan 1, 1991
0.728
+0.728
0.0%
jan 1, 1992
-6.024
-6.753
-927.25%
jan 1, 1993
-1.186
+4.839
-80.32%
jan 1, 1994
4.136
+5.322
-448.91%
jan 1, 1995
-0.833
-4.969
-120.14%
jan 1, 1996
2.583
+3.415
-410.05%
jan 1, 1997
3.615
+1.033
39.99%
jan 1, 1998
8.444
+4.829
133.58%
jan 1, 1999
-1.236
-9.68
-114.63%
jan 1, 2000
6.671
+7.907
-639.93%
jan 1, 2001
4.831
-1.84
-27.59%
jan 1, 2002
5.194
+0.364
7.53%
jan 1, 2003
0.521
-4.673
-89.96%
jan 1, 2004
0.675
+0.154
29.54%
jan 1, 2005
11.697
+11.022
1.63K%
jan 1, 2006
-2.14
-13.837
-118.3%
jan 1, 2007
1.944
+4.084
-190.83%
jan 1, 2008
-1.425
-3.369
-173.32%
jan 1, 2009
-2.201
-0.776
54.42%
jan 1, 2010
-3.176
-0.975
44.3%
jan 1, 2011
1.274
+4.451
-140.13%
jan 1, 2012
6.282
+5.008
392.94%
jan 1, 2013
7.205
+0.923
14.69%
jan 1, 2014
-0.019
-7.224
-100.27%
jan 1, 2015
-3.241
-3.222
16.74K%
jan 1, 2016
-7.249
-4.008
123.67%
Ranking of countries by current statistics by years


Comments: