29
/
en
AIzaSyAYiBZKx7MnpbEhh9jyipgxe19OcubqV5w
April 1, 2024
287135
Zimbabwe
ZWE
true
2
1
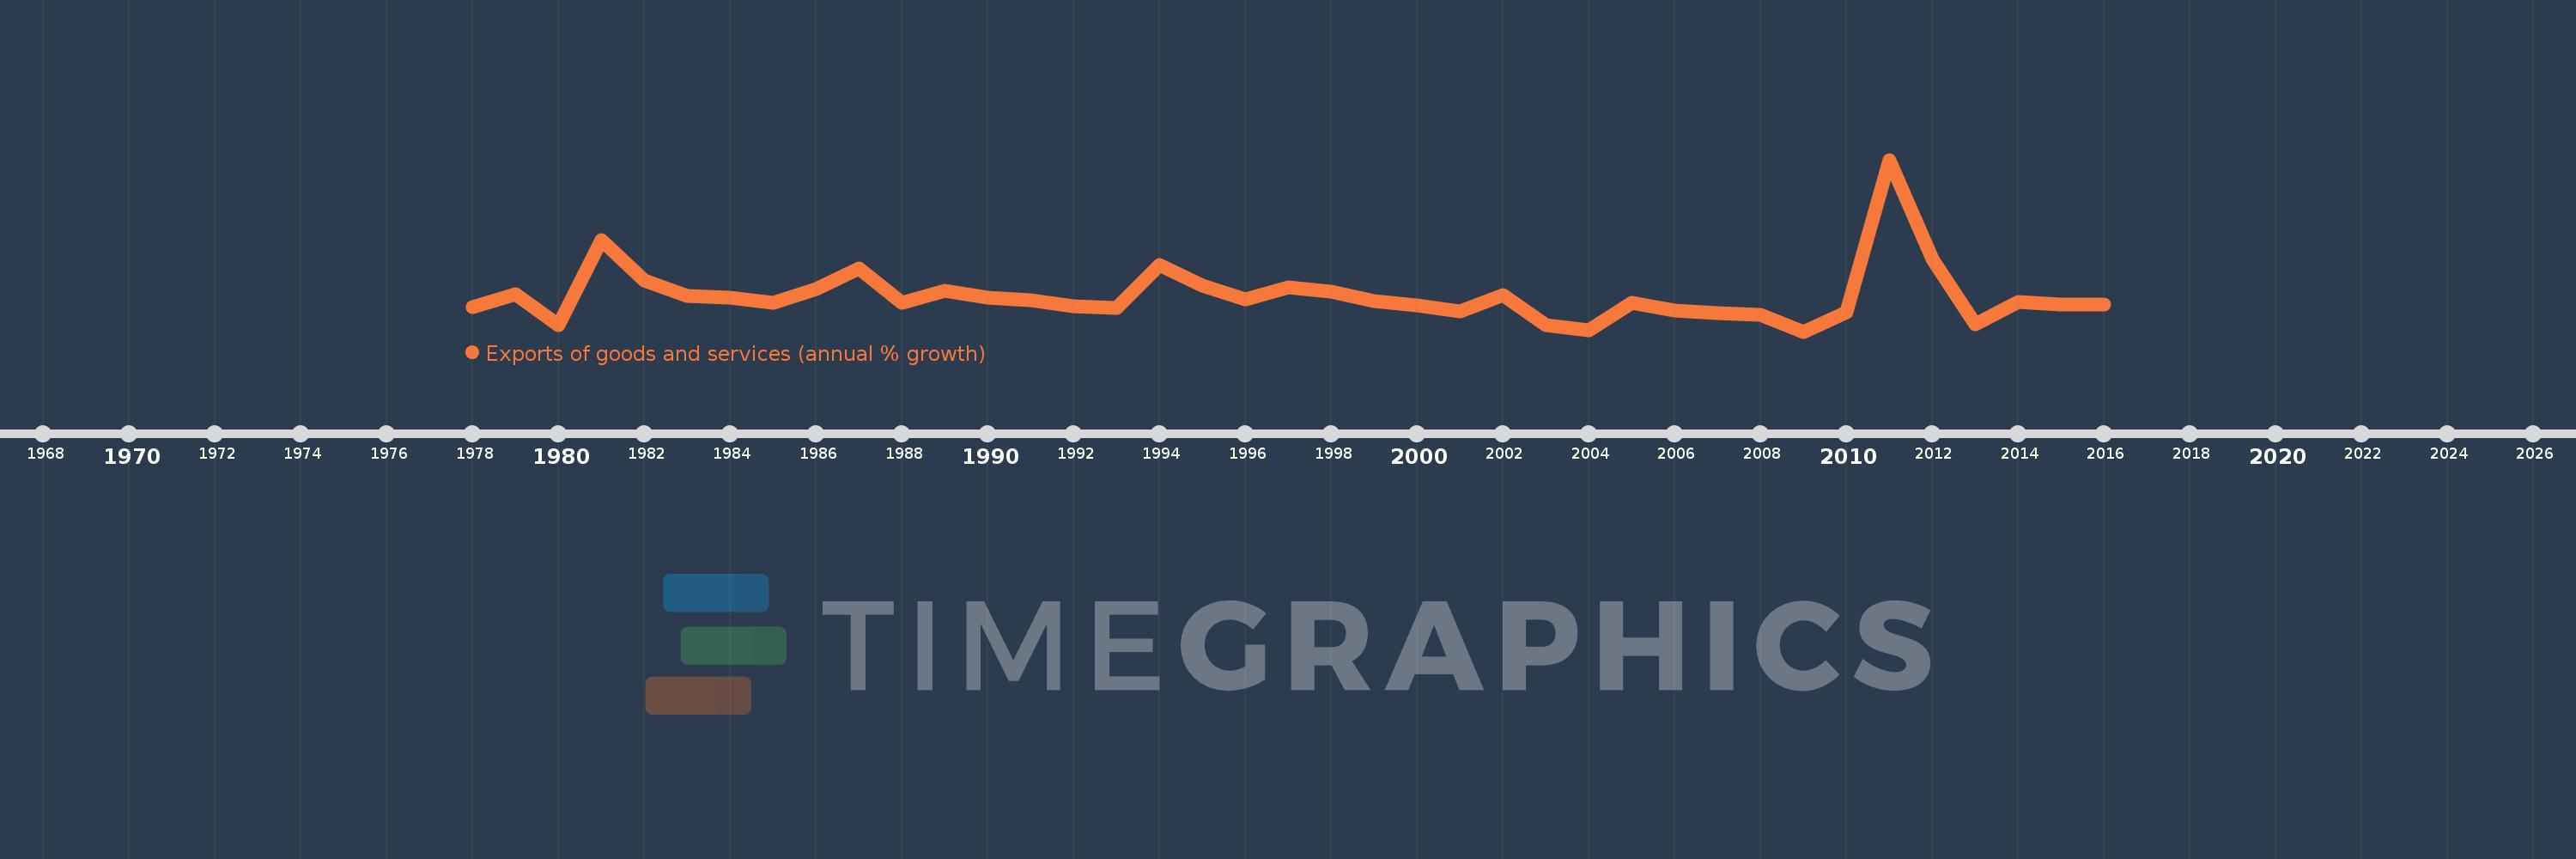
Exports of goods and services (annual % growth)
2016,2015,2014,2013,2012,2011,2010,2009,2008,2007,2006,2005,2004,2003,2002,2001,2000,1999,1998,1997,1996,1995,1994,1993,1992,1991,1990,1989,1988,1987,1986,1985,1984,1983,1982,1981,1980,1979,1978
This statistics in other country:
AlbaniaAlgeriaAngolaAntigua and BarbudaArab WorldArgentinaArmeniaAustraliaAustriaAzerbaijanBahamas, TheBahrainBangladeshBarbadosBelarusBelgiumBelizeBeninBhutanBoliviaBosnia and HerzegovinaBotswanaBrazilBrunei DarussalamBulgariaBurkina FasoBurundiCabo VerdeCambodiaCameroonCanadaCaribbean small statesCentral Europe and the BalticsChadChileColombiaComorosCongo, Dem. Rep.Congo, Rep.Costa RicaCote d'IvoireCroatiaCubaCyprusCzech RepublicDenmarkDjiboutiDominican RepublicEarly-demographic dividendEast Asia & PacificEcuadorEgypt, Arab Rep.El SalvadorEquatorial GuineaEritreaEstoniaEthiopiaEuro areaEurope & Central AsiaEurope & Central Asia (excluding high income)Europe & Central Asia (IDA & IBRD countries)European UnionFijiFinlandFranceGabonGambia, TheGeorgiaGermanyGhanaGreeceGuatemalaGuineaGuinea-BissauHaitiHeavily indebted poor countries (HIPC)High incomeHondurasHong Kong SAR, ChinaHungaryIBRD onlyIcelandIDA & IBRD totalIDA blendIDA onlyIDA totalIndiaIndonesiaIran, Islamic Rep.IrelandIsraelItalyJamaicaJapanJordanKazakhstanKenyaKorea, Rep.KosovoKuwaitKyrgyz RepublicLao PDRLatin America & Caribbean Latin America & Caribbean (excluding high income)Latin America & the Caribbean (IDA & IBRD countries)LatviaLebanonLiberiaLibyaLithuaniaLow & middle incomeLow incomeLower middle incomeLuxembourgMacao SAR, ChinaMacedonia, FYRMadagascarMalawiMalaysiaMaliMaltaMauritaniaMauritiusMexicoMiddle East & North AfricaMiddle East & North Africa (excluding high income)Middle East & North Africa (IDA & IBRD countries)Middle incomeMoldovaMongoliaMontenegroMoroccoMozambiqueMyanmarNamibiaNepalNetherlandsNew ZealandNicaraguaNigerNigeriaNorth AmericaNorwayOECD membersOmanOther small statesPakistanPanamaPapua New GuineaParaguayPeruPhilippinesPolandPortugalPost-demographic dividendPre-demographic dividendPuerto RicoQatarRomaniaRussian FederationRwandaSamoaSaudi ArabiaSenegalSerbiaSeychellesSierra LeoneSingaporeSlovak RepublicSloveniaSmall statesSomaliaSouth AfricaSouth AsiaSouth Asia (IDA & IBRD)South SudanSpainSri LankaSub-Saharan Africa Sub-Saharan Africa (excluding high income)Sub-Saharan Africa (IDA & IBRD countries)SudanSurinameSwazilandSwedenSwitzerlandSyrian Arab RepublicTajikistanTanzaniaThailandTimor-LesteTogoTrinidad and TobagoTunisiaTurkeyTurkmenistanUgandaUkraineUnited Arab EmiratesUnited KingdomUnited StatesUruguayUzbekistanVanuatuVenezuela, RBVietnamWest Bank and GazaWorldZambiaZimbabwe Timeline:
This timeline shows a graph from 1978 to 2016 of Zimbabwe. No data until 1977. Number of actual observations by date: 39.
Source name:
World Development Indicators
Source organization:
World Bank national accounts data, and OECD National Accounts data files.
Categories, topics:
Economy & Growth, Trade
Last updated:
apr 23, 2017
Indicators value changes by year
Minimum:
-21.084
jan 1, 2009
Maximum:
92.703
jan 1, 2011
At the date of observation
Value
Absolute change
Change from previous value
jan 1, 1978
-5.091
-5.091
0.0%
jan 1, 1979
3.947
+9.038
-177.53%
jan 1, 1980
-16.748
-20.695
-524.29%
jan 1, 1981
39.286
+56.033
-334.57%
jan 1, 1982
12.525
-26.76
-68.12%
jan 1, 1983
2.634
-9.891
-78.97%
jan 1, 1984
1.585
-1.049
-39.82%
jan 1, 1985
-1.907
-3.493
-220.31%
jan 1, 1986
6.945
+8.852
-464.11%
jan 1, 1987
20.805
+13.86
199.57%
jan 1, 1988
-2.089
-22.894
-110.04%
jan 1, 1989
6.079
+8.168
-390.94%
jan 1, 1990
1.226
-4.852
-79.82%
jan 1, 1991
-0.048
-1.274
-103.89%
jan 1, 1992
-4.38
-4.332
9.07K%
jan 1, 1993
-5.323
-0.943
21.52%
jan 1, 1994
22.773
+28.095
-527.85%
jan 1, 1995
9.39
-13.383
-58.77%
jan 1, 1996
0.487
-8.903
-94.81%
jan 1, 1997
8.138
+7.651
1.57K%
jan 1, 1998
5.518
-2.62
-32.2%
jan 1, 1999
-0.679
-6.197
-112.31%
jan 1, 2000
-3.663
-2.984
439.45%
jan 1, 2001
-7.732
-4.069
111.1%
jan 1, 2002
3.276
+11.009
-142.37%
jan 1, 2003
-16.965
-20.241
-617.82%
jan 1, 2004
-20.437
-3.472
20.47%
jan 1, 2005
-2.056
+18.381
-89.94%
jan 1, 2006
-7.342
-5.285
257.03%
jan 1, 2007
-8.942
-1.601
21.8%
jan 1, 2008
-9.786
-0.844
9.44%
jan 1, 2009
-21.084
-11.298
115.45%
jan 1, 2010
-8.268
+12.816
-60.79%
jan 1, 2011
92.703
+100.971
-1.22K%
jan 1, 2012
27.08
-65.623
-70.79%
jan 1, 2013
-16.194
-43.274
-159.8%
jan 1, 2014
-1.342
+14.852
-91.71%
jan 1, 2015
-3.069
-1.726
128.63%
jan 1, 2016
-3.03
+0.039
-1.26%
Ranking of countries by current statistics by years


Comments: