29
/
en
AIzaSyAYiBZKx7MnpbEhh9jyipgxe19OcubqV5w
April 1, 2024
32564
Europe & Central Asia (IDA & IBRD countries)
TEC
false
2
1
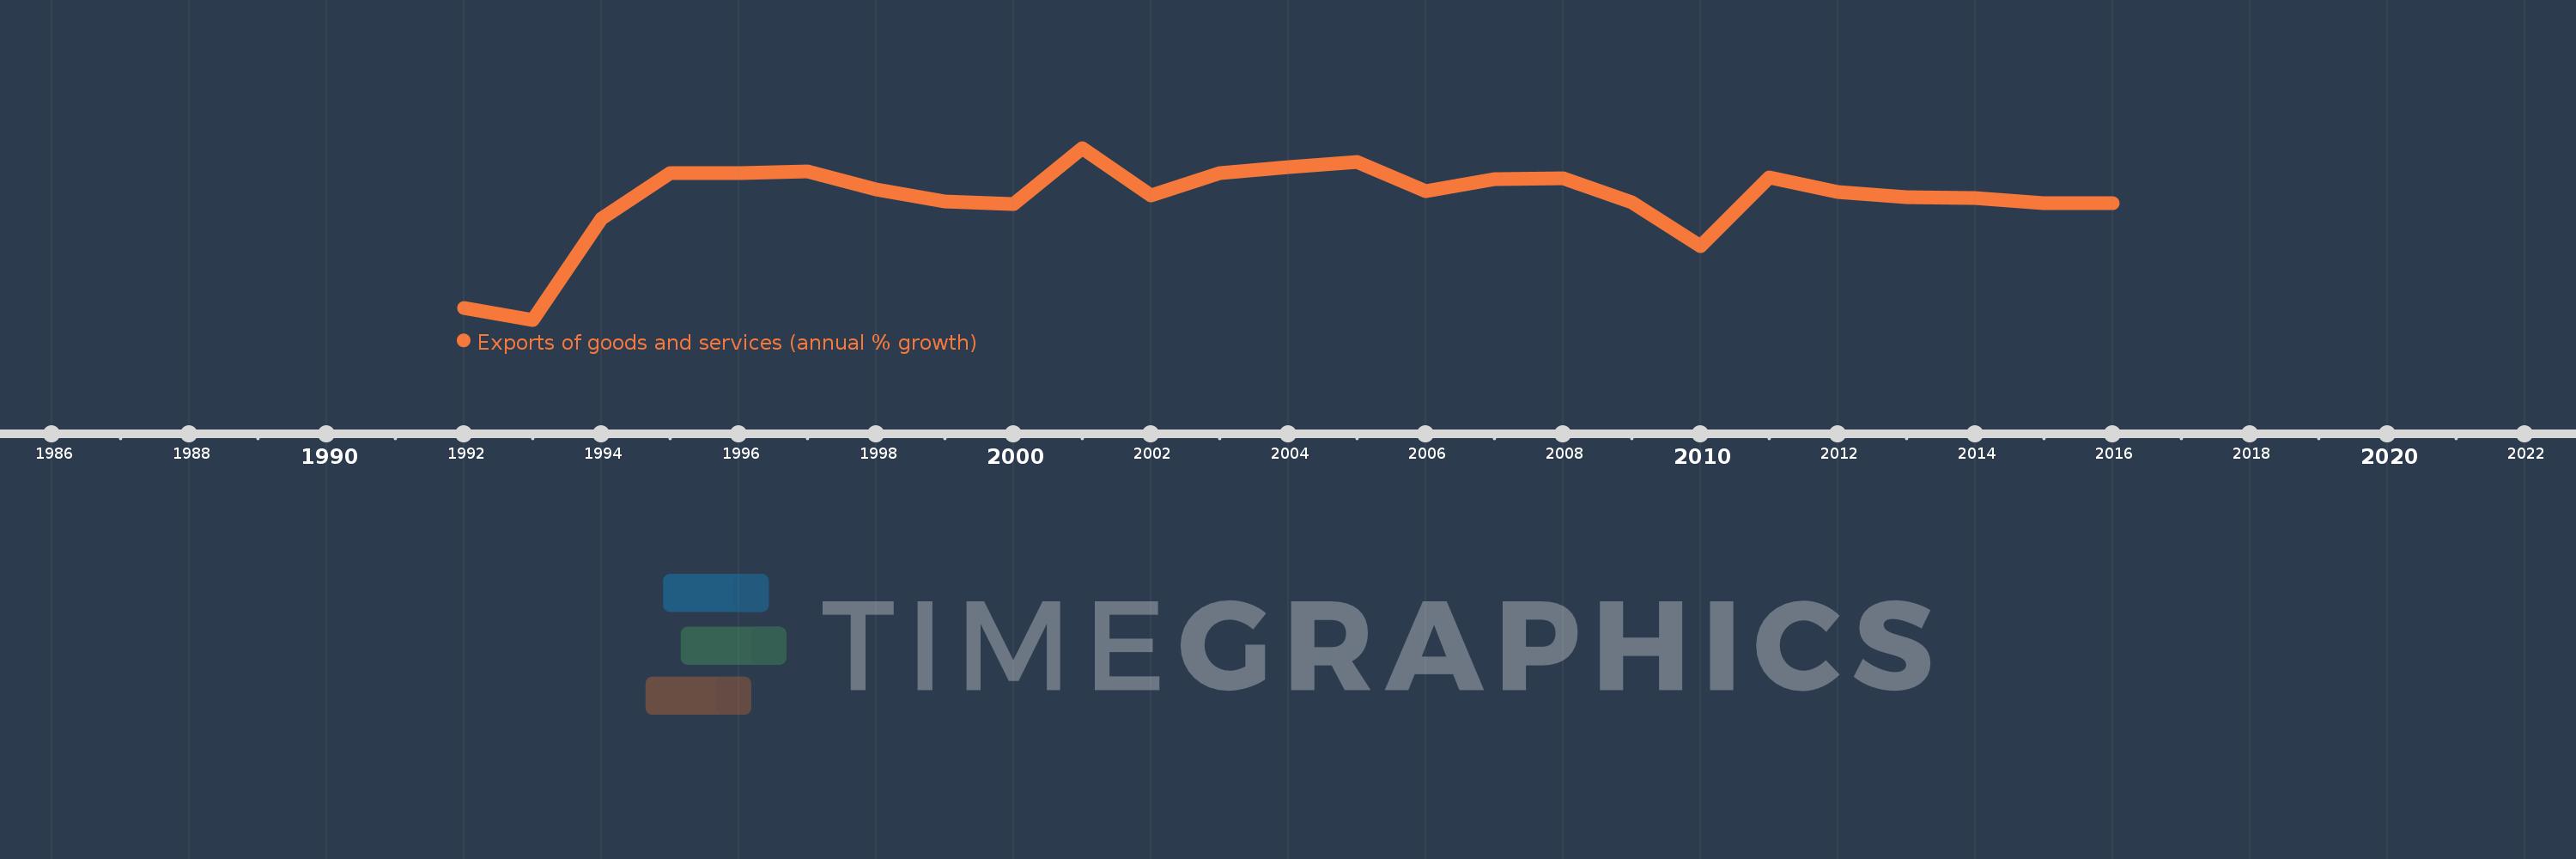
Exports of goods and services (annual % growth)
2016,2015,2014,2013,2012,2011,2010,2009,2008,2007,2006,2005,2004,2003,2002,2001,2000,1999,1998,1997,1996,1995,1994,1993,1992
This statistics in other country:
AlbaniaAlgeriaAngolaAntigua and BarbudaArab WorldArgentinaArmeniaAustraliaAustriaAzerbaijanBahamas, TheBahrainBangladeshBarbadosBelarusBelgiumBelizeBeninBhutanBoliviaBosnia and HerzegovinaBotswanaBrazilBrunei DarussalamBulgariaBurkina FasoBurundiCabo VerdeCambodiaCameroonCanadaCaribbean small statesCentral Europe and the BalticsChadChileColombiaComorosCongo, Dem. Rep.Congo, Rep.Costa RicaCote d'IvoireCroatiaCubaCyprusCzech RepublicDenmarkDjiboutiDominican RepublicEarly-demographic dividendEast Asia & PacificEcuadorEgypt, Arab Rep.El SalvadorEquatorial GuineaEritreaEstoniaEthiopiaEuro areaEurope & Central AsiaEurope & Central Asia (excluding high income)Europe & Central Asia (IDA & IBRD countries)European UnionFijiFinlandFranceGabonGambia, TheGeorgiaGermanyGhanaGreeceGuatemalaGuineaGuinea-BissauHaitiHeavily indebted poor countries (HIPC)High incomeHondurasHong Kong SAR, ChinaHungaryIBRD onlyIcelandIDA & IBRD totalIDA blendIDA onlyIDA totalIndiaIndonesiaIran, Islamic Rep.IrelandIsraelItalyJamaicaJapanJordanKazakhstanKenyaKorea, Rep.KosovoKuwaitKyrgyz RepublicLao PDRLatin America & Caribbean Latin America & Caribbean (excluding high income)Latin America & the Caribbean (IDA & IBRD countries)LatviaLebanonLiberiaLibyaLithuaniaLow & middle incomeLow incomeLower middle incomeLuxembourgMacao SAR, ChinaMacedonia, FYRMadagascarMalawiMalaysiaMaliMaltaMauritaniaMauritiusMexicoMiddle East & North AfricaMiddle East & North Africa (excluding high income)Middle East & North Africa (IDA & IBRD countries)Middle incomeMoldovaMongoliaMontenegroMoroccoMozambiqueMyanmarNamibiaNepalNetherlandsNew ZealandNicaraguaNigerNigeriaNorth AmericaNorwayOECD membersOmanOther small statesPakistanPanamaPapua New GuineaParaguayPeruPhilippinesPolandPortugalPost-demographic dividendPre-demographic dividendPuerto RicoQatarRomaniaRussian FederationRwandaSamoaSaudi ArabiaSenegalSerbiaSeychellesSierra LeoneSingaporeSlovak RepublicSloveniaSmall statesSomaliaSouth AfricaSouth AsiaSouth Asia (IDA & IBRD)South SudanSpainSri LankaSub-Saharan Africa Sub-Saharan Africa (excluding high income)Sub-Saharan Africa (IDA & IBRD countries)SudanSurinameSwazilandSwedenSwitzerlandSyrian Arab RepublicTajikistanTanzaniaThailandTimor-LesteTogoTrinidad and TobagoTunisiaTurkeyTurkmenistanUgandaUkraineUnited Arab EmiratesUnited KingdomUnited StatesUruguayUzbekistanVanuatuVenezuela, RBVietnamWest Bank and GazaWorldZambiaZimbabwe Timeline:
This timeline shows a graph from 1992 to 2016 of Europe & Central Asia (IDA & IBRD countries). No data until 1991. Number of actual observations by date: 25.
Source name:
World Development Indicators
Source organization:
World Bank national accounts data, and OECD National Accounts data files.
Categories, topics:
Economy & Growth, Trade
Last updated:
apr 23, 2017
Indicators value changes by year
Minimum:
-23.391
jan 1, 1993
At the date of observation
Value
Absolute change
Change from previous value
jan 1, 1992
-20.819
-20.819
0.0%
jan 1, 1993
-23.391
-2.572
12.36%
jan 1, 1994
-0.93
+22.461
-96.02%
jan 1, 1995
9.381
+10.311
-1.11K%
jan 1, 1996
9.299
-0.082
-0.88%
jan 1, 1997
9.756
+0.457
4.92%
jan 1, 1998
5.575
-4.182
-42.86%
jan 1, 1999
2.891
-2.684
-48.14%
jan 1, 2000
2.369
-0.522
-18.07%
jan 1, 2001
14.91
+12.541
529.46%
jan 1, 2002
4.374
-10.536
-70.67%
jan 1, 2003
9.298
+4.924
112.58%
jan 1, 2004
10.722
+1.424
15.32%
jan 1, 2005
11.821
+1.099
10.25%
jan 1, 2006
5.301
-6.52
-55.16%
jan 1, 2007
7.867
+2.567
48.42%
jan 1, 2008
8.074
+0.207
2.63%
jan 1, 2009
2.717
-5.357
-66.35%
jan 1, 2010
-6.894
-9.611
-353.72%
jan 1, 2011
8.254
+15.148
-219.73%
jan 1, 2012
5.013
-3.242
-39.27%
jan 1, 2013
3.997
-1.016
-20.27%
jan 1, 2014
3.742
-0.255
-6.38%
jan 1, 2015
2.691
-1.051
-28.09%
jan 1, 2016
2.537
-0.154
-5.71%
Ranking of countries by current statistics by years


Comments: