29
/
en
AIzaSyAYiBZKx7MnpbEhh9jyipgxe19OcubqV5w
April 1, 2024
93030
Brunei Darussalam
BRN
true
2
1
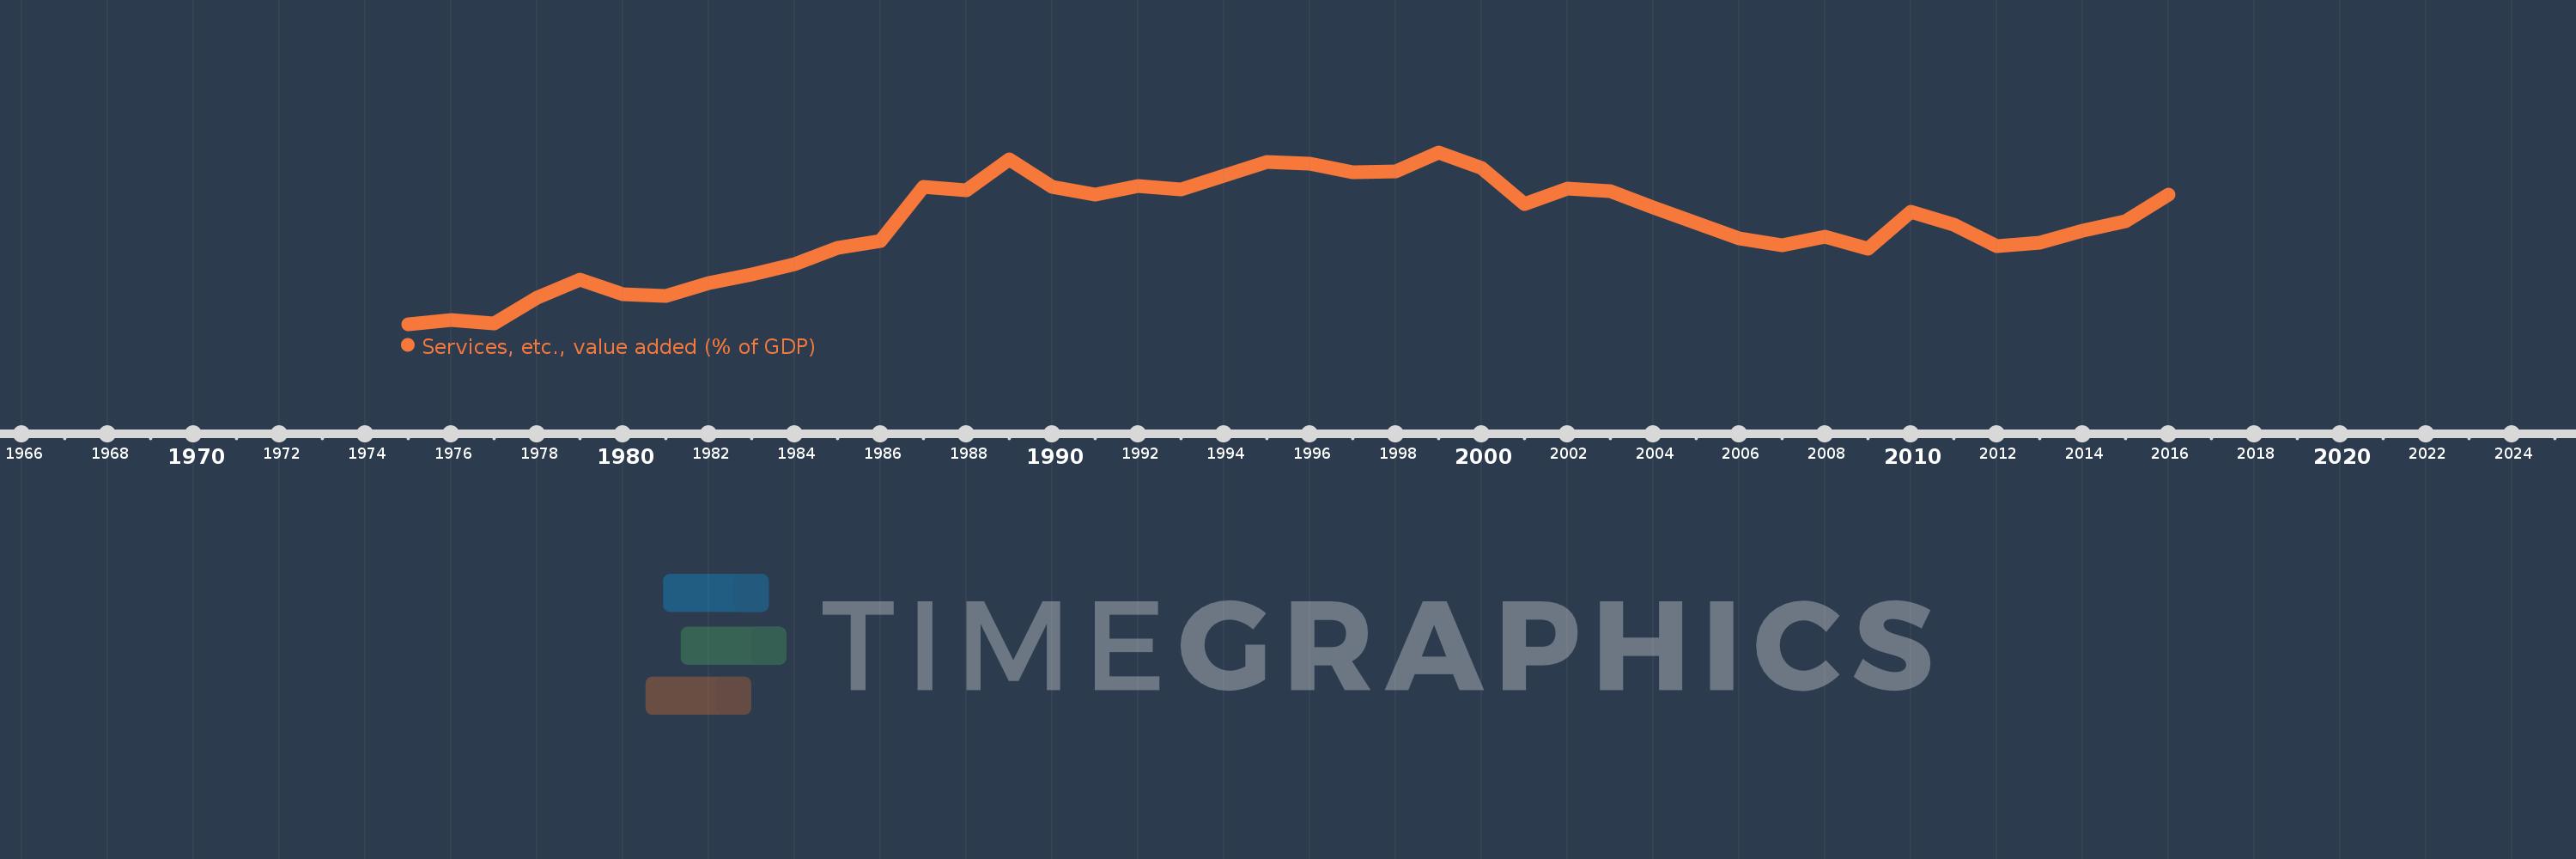
Services, etc., value added (% of GDP)
2016,2015,2014,2013,2012,2011,2010,2009,2008,2007,2006,2005,2004,2003,2002,2001,2000,1999,1998,1997,1996,1995,1994,1993,1992,1991,1990,1989,1988,1987,1986,1985,1984,1983,1982,1981,1980,1979,1978,1977,1976,1975
This statistics in other country:
AfghanistanAlbaniaAlgeriaAndorraAngolaAntigua and BarbudaArab WorldArgentinaArmeniaArubaAustraliaAustriaAzerbaijanBahamas, TheBahrainBangladeshBarbadosBelarusBelgiumBelizeBeninBermudaBhutanBoliviaBosnia and HerzegovinaBotswanaBrazilBrunei DarussalamBulgariaBurkina FasoBurundiCabo VerdeCambodiaCameroonCanadaCaribbean small statesCentral African RepublicCentral Europe and the BalticsChadChileChinaColombiaComorosCongo, Dem. Rep.Congo, Rep.Costa RicaCote d'IvoireCroatiaCubaCyprusCzech RepublicDenmarkDjiboutiDominicaDominican RepublicEarly-demographic dividendEast Asia & PacificEast Asia & Pacific (excluding high income)East Asia & Pacific (IDA & IBRD countries)EcuadorEgypt, Arab Rep.El SalvadorEquatorial GuineaEritreaEstoniaEthiopiaEuro areaEurope & Central AsiaEurope & Central Asia (excluding high income)Europe & Central Asia (IDA & IBRD countries)European UnionFaroe IslandsFijiFinlandFragile and conflict affected situationsFranceGabonGambia, TheGeorgiaGermanyGhanaGreeceGrenadaGuatemalaGuineaGuinea-BissauGuyanaHeavily indebted poor countries (HIPC)High incomeHondurasHong Kong SAR, ChinaHungaryIBRD onlyIcelandIDA & IBRD totalIDA blendIDA onlyIDA totalIndiaIndonesiaIran, Islamic Rep.IrelandItalyJamaicaJapanJordanKazakhstanKenyaKiribatiKorea, Rep.KosovoKuwaitKyrgyz RepublicLao PDRLate-demographic dividendLatin America & Caribbean Latin America & Caribbean (excluding high income)Latin America & the Caribbean (IDA & IBRD countries)LatviaLeast developed countries: UN classificationLebanonLesothoLibyaLithuaniaLow & middle incomeLow incomeLower middle incomeLuxembourgMacao SAR, ChinaMacedonia, FYRMadagascarMalawiMalaysiaMaldivesMaliMaltaMarshall IslandsMauritaniaMauritiusMexicoMicronesia, Fed. Sts.Middle East & North AfricaMiddle East & North Africa (excluding high income)Middle East & North Africa (IDA & IBRD countries)Middle incomeMoldovaMongoliaMontenegroMoroccoMozambiqueMyanmarNamibiaNepalNetherlandsNew CaledoniaNew ZealandNicaraguaNigerNigeriaNorth AmericaNorwayOECD membersOmanOther small statesPacific island small statesPakistanPalauPanamaPapua New GuineaParaguayPeruPhilippinesPolandPortugalPost-demographic dividendPre-demographic dividendPuerto RicoQatarRomaniaRussian FederationRwandaSao Tome and PrincipeSaudi ArabiaSenegalSerbiaSeychellesSierra LeoneSingaporeSlovak RepublicSloveniaSmall statesSolomon IslandsSomaliaSouth AfricaSouth AsiaSouth Asia (IDA & IBRD)SpainSri LankaSt. Kitts and NevisSt. LuciaSt. Vincent and the GrenadinesSub-Saharan Africa Sub-Saharan Africa (excluding high income)Sub-Saharan Africa (IDA & IBRD countries)SudanSurinameSwazilandSwedenSwitzerlandSyrian Arab RepublicTajikistanTanzaniaThailandTimor-LesteTogoTongaTrinidad and TobagoTunisiaTurkeyTurkmenistanTuvaluUgandaUkraineUnited KingdomUnited StatesUpper middle incomeUruguayUzbekistanVanuatuVenezuela, RBVietnamWest Bank and GazaWorldYemen, Rep.ZambiaZimbabwe Timeline:
This timeline shows a graph from 1975 to 2016 of Brunei Darussalam. No data until 1974. Number of actual observations by date: 42.
Source name:
World Development Indicators
Source organization:
World Bank national accounts data, and OECD National Accounts data files.
Categories, topics:
Economy & Growth
Last updated:
apr 23, 2017
Indicators value changes by year
Maximum:
47.056
jan 1, 1999
At the date of observation
Value
Absolute change
Change from previous value
jan 1, 1975
8.149
+8.149
0.0%
jan 1, 1976
9.147
+0.997
12.24%
jan 1, 1977
8.421
-0.725
-7.93%
jan 1, 1978
14.214
+5.793
68.79%
jan 1, 1979
18.305
+4.091
28.78%
jan 1, 1980
14.894
-3.411
-18.63%
jan 1, 1981
14.541
-0.353
-2.37%
jan 1, 1982
17.459
+2.918
20.07%
jan 1, 1983
19.467
+2.008
11.5%
jan 1, 1984
21.7
+2.233
11.47%
jan 1, 1985
25.463
+3.763
17.34%
jan 1, 1986
26.977
+1.513
5.94%
jan 1, 1987
39.267
+12.291
45.56%
jan 1, 1988
38.561
-0.706
-1.8%
jan 1, 1989
45.52
+6.958
18.05%
jan 1, 1990
39.236
-6.284
-13.8%
jan 1, 1991
37.476
-1.76
-4.49%
jan 1, 1992
39.405
+1.93
5.15%
jan 1, 1993
38.636
-0.77
-1.95%
jan 1, 1994
41.688
+3.052
7.9%
jan 1, 1995
44.973
+3.285
7.88%
jan 1, 1996
44.567
-0.405
-0.9%
jan 1, 1997
42.574
-1.994
-4.47%
jan 1, 1998
42.727
+0.154
0.36%
jan 1, 1999
47.056
+4.329
10.13%
jan 1, 2000
43.58
-3.475
-7.39%
jan 1, 2001
35.306
-8.275
-18.99%
jan 1, 2002
38.823
+3.517
9.96%
jan 1, 2003
38.244
-0.579
-1.49%
jan 1, 2004
34.63
-3.614
-9.45%
jan 1, 2005
31.019
-3.611
-10.43%
jan 1, 2006
27.493
-3.526
-11.37%
jan 1, 2007
26.117
-1.376
-5.0%
jan 1, 2008
28.006
+1.888
7.23%
jan 1, 2009
25.251
-2.754
-9.84%
jan 1, 2010
33.686
+8.435
33.4%
jan 1, 2011
30.61
-3.076
-9.13%
jan 1, 2012
25.752
-4.858
-15.87%
jan 1, 2013
26.694
+0.942
3.66%
jan 1, 2014
29.29
+2.596
9.73%
jan 1, 2015
31.39
+2.1
7.17%
jan 1, 2016
37.535
+6.145
19.58%
Ranking of countries by current statistics by years


Comments: