29
/
en
AIzaSyAYiBZKx7MnpbEhh9jyipgxe19OcubqV5w
April 1, 2024
235142
Saudi Arabia
SAU
true
2
1
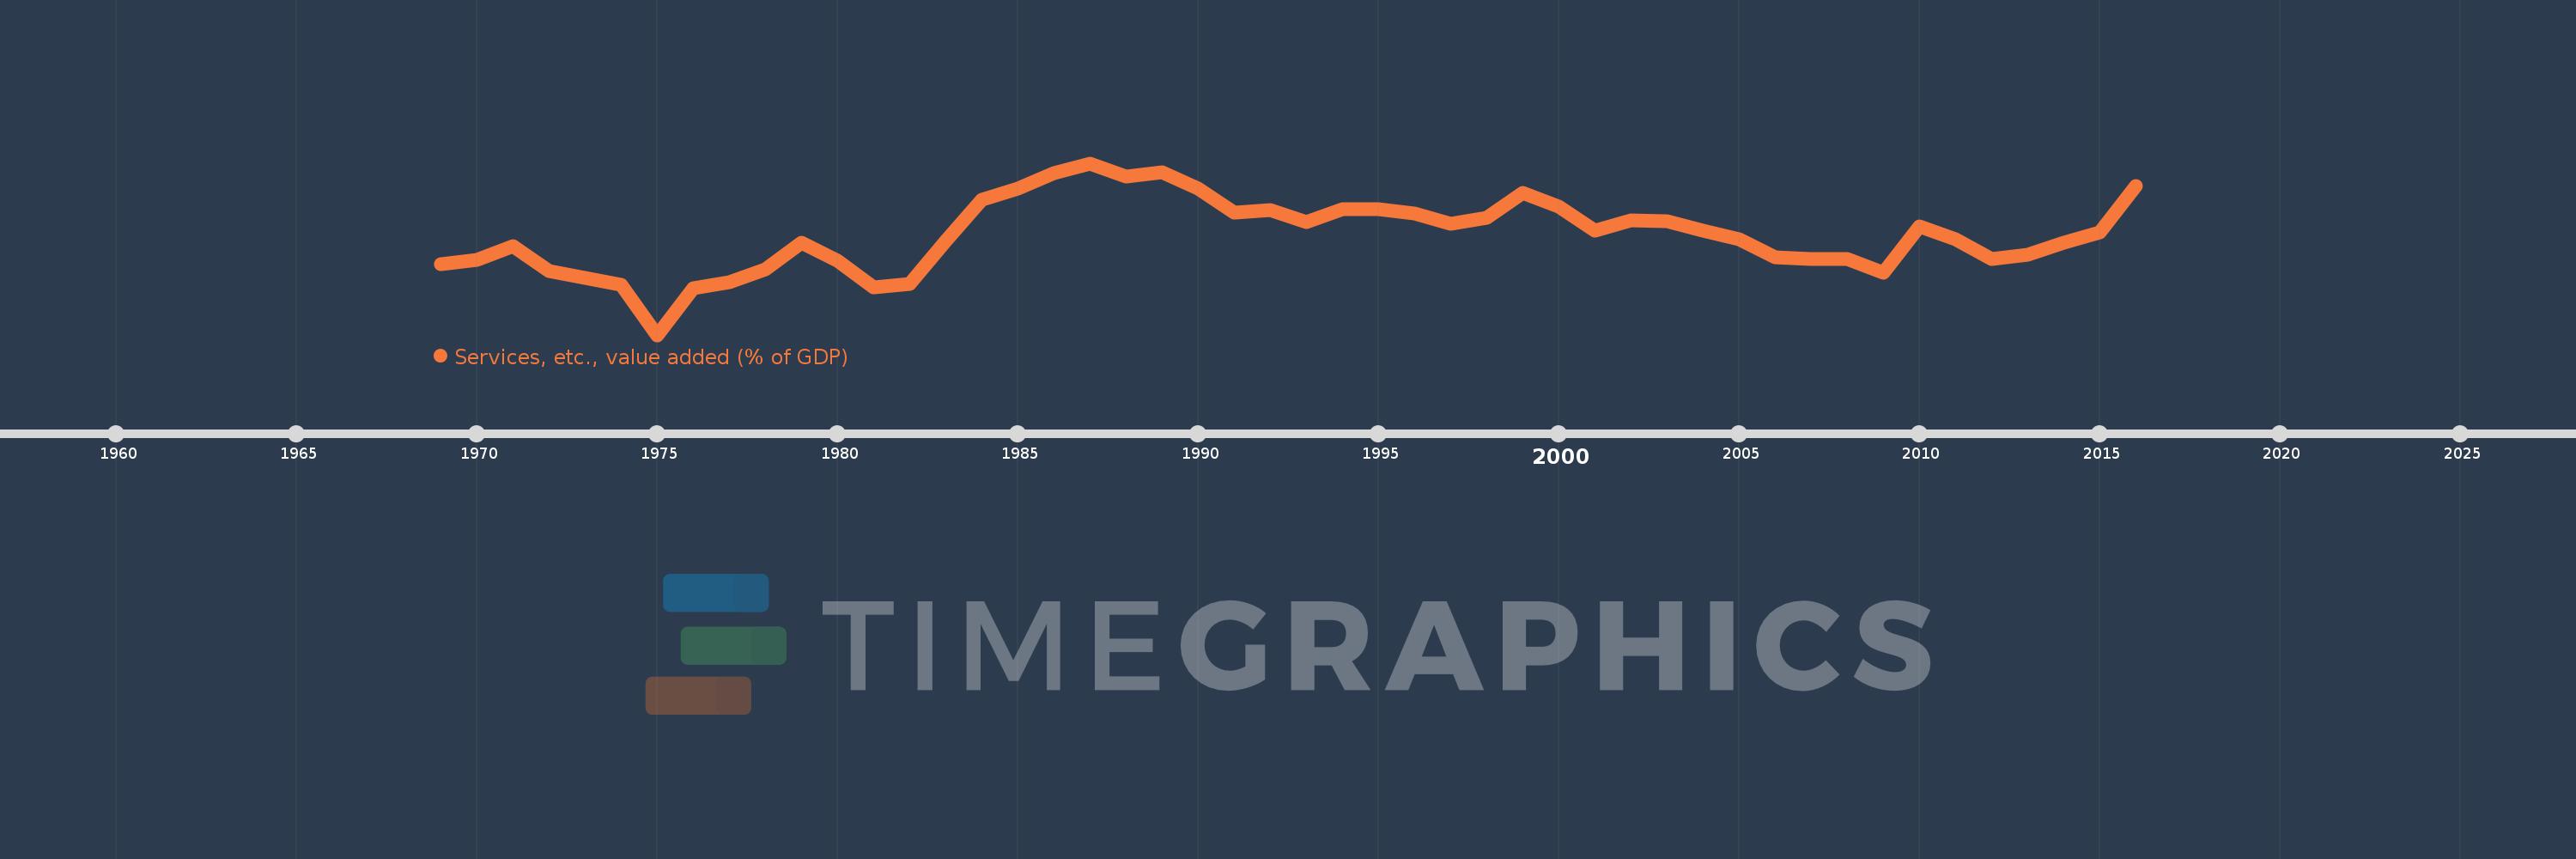
Services, etc., value added (% of GDP)
2016,2015,2014,2013,2012,2011,2010,2009,2008,2007,2006,2005,2004,2003,2002,2001,2000,1999,1998,1997,1996,1995,1994,1993,1992,1991,1990,1989,1988,1987,1986,1985,1984,1983,1982,1981,1980,1979,1978,1977,1976,1975,1974,1973,1972,1971,1970,1969
This statistics in other country:
AfghanistanAlbaniaAlgeriaAndorraAngolaAntigua and BarbudaArab WorldArgentinaArmeniaArubaAustraliaAustriaAzerbaijanBahamas, TheBahrainBangladeshBarbadosBelarusBelgiumBelizeBeninBermudaBhutanBoliviaBosnia and HerzegovinaBotswanaBrazilBrunei DarussalamBulgariaBurkina FasoBurundiCabo VerdeCambodiaCameroonCanadaCaribbean small statesCentral African RepublicCentral Europe and the BalticsChadChileChinaColombiaComorosCongo, Dem. Rep.Congo, Rep.Costa RicaCote d'IvoireCroatiaCubaCyprusCzech RepublicDenmarkDjiboutiDominicaDominican RepublicEarly-demographic dividendEast Asia & PacificEast Asia & Pacific (excluding high income)East Asia & Pacific (IDA & IBRD countries)EcuadorEgypt, Arab Rep.El SalvadorEquatorial GuineaEritreaEstoniaEthiopiaEuro areaEurope & Central AsiaEurope & Central Asia (excluding high income)Europe & Central Asia (IDA & IBRD countries)European UnionFaroe IslandsFijiFinlandFragile and conflict affected situationsFranceGabonGambia, TheGeorgiaGermanyGhanaGreeceGrenadaGuatemalaGuineaGuinea-BissauGuyanaHeavily indebted poor countries (HIPC)High incomeHondurasHong Kong SAR, ChinaHungaryIBRD onlyIcelandIDA & IBRD totalIDA blendIDA onlyIDA totalIndiaIndonesiaIran, Islamic Rep.IrelandItalyJamaicaJapanJordanKazakhstanKenyaKiribatiKorea, Rep.KosovoKuwaitKyrgyz RepublicLao PDRLate-demographic dividendLatin America & Caribbean Latin America & Caribbean (excluding high income)Latin America & the Caribbean (IDA & IBRD countries)LatviaLeast developed countries: UN classificationLebanonLesothoLibyaLithuaniaLow & middle incomeLow incomeLower middle incomeLuxembourgMacao SAR, ChinaMacedonia, FYRMadagascarMalawiMalaysiaMaldivesMaliMaltaMarshall IslandsMauritaniaMauritiusMexicoMicronesia, Fed. Sts.Middle East & North AfricaMiddle East & North Africa (excluding high income)Middle East & North Africa (IDA & IBRD countries)Middle incomeMoldovaMongoliaMontenegroMoroccoMozambiqueMyanmarNamibiaNepalNetherlandsNew CaledoniaNew ZealandNicaraguaNigerNigeriaNorth AmericaNorwayOECD membersOmanOther small statesPacific island small statesPakistanPalauPanamaPapua New GuineaParaguayPeruPhilippinesPolandPortugalPost-demographic dividendPre-demographic dividendPuerto RicoQatarRomaniaRussian FederationRwandaSao Tome and PrincipeSaudi ArabiaSenegalSerbiaSeychellesSierra LeoneSingaporeSlovak RepublicSloveniaSmall statesSolomon IslandsSomaliaSouth AfricaSouth AsiaSouth Asia (IDA & IBRD)SpainSri LankaSt. Kitts and NevisSt. LuciaSt. Vincent and the GrenadinesSub-Saharan Africa Sub-Saharan Africa (excluding high income)Sub-Saharan Africa (IDA & IBRD countries)SudanSurinameSwazilandSwedenSwitzerlandSyrian Arab RepublicTajikistanTanzaniaThailandTimor-LesteTogoTongaTrinidad and TobagoTunisiaTurkeyTurkmenistanTuvaluUgandaUkraineUnited KingdomUnited StatesUpper middle incomeUruguayUzbekistanVanuatuVenezuela, RBVietnamWest Bank and GazaWorldYemen, Rep.ZambiaZimbabwe Timeline:
This timeline shows a graph from 1969 to 2016 of Saudi Arabia. No data until 1968. Number of actual observations by date: 48.
Source name:
World Development Indicators
Source organization:
World Bank national accounts data, and OECD National Accounts data files.
Categories, topics:
Economy & Growth
Last updated:
apr 23, 2017
Indicators value changes by year
Minimum:
16.037
jan 1, 1975
Maximum:
57.254
jan 1, 1987
At the date of observation
Value
Absolute change
Change from previous value
jan 1, 1969
33.022
+33.022
0.0%
jan 1, 1970
33.969
+0.947
2.87%
jan 1, 1971
37.408
+3.439
10.12%
jan 1, 1972
31.306
-6.102
-16.31%
jan 1, 1973
29.843
-1.462
-4.67%
jan 1, 1974
28.058
-1.786
-5.98%
jan 1, 1975
16.037
-12.021
-42.84%
jan 1, 1976
27.224
+11.187
69.76%
jan 1, 1977
28.657
+1.433
5.26%
jan 1, 1978
31.778
+3.121
10.89%
jan 1, 1979
38.246
+6.468
20.35%
jan 1, 1980
33.897
-4.35
-11.37%
jan 1, 1981
27.519
-6.377
-18.81%
jan 1, 1982
28.237
+0.718
2.61%
jan 1, 1983
38.608
+10.371
36.73%
jan 1, 1984
48.418
+9.81
25.41%
jan 1, 1985
51.145
+2.727
5.63%
jan 1, 1986
54.897
+3.752
7.34%
jan 1, 1987
57.254
+2.357
4.29%
jan 1, 1988
54.154
-3.1
-5.41%
jan 1, 1989
55.125
+0.971
1.79%
jan 1, 1990
51.253
-3.872
-7.02%
jan 1, 1991
45.466
-5.787
-11.29%
jan 1, 1992
46.041
+0.575
1.26%
jan 1, 1993
43.074
-2.967
-6.44%
jan 1, 1994
46.271
+3.198
7.42%
jan 1, 1995
46.329
+0.058
0.12%
jan 1, 1996
45.226
-1.102
-2.38%
jan 1, 1997
42.673
-2.553
-5.65%
jan 1, 1998
44.065
+1.392
3.26%
jan 1, 1999
50.236
+6.171
14.0%
jan 1, 2000
46.914
-3.322
-6.61%
jan 1, 2001
41.145
-5.769
-12.3%
jan 1, 2002
43.57
+2.425
5.89%
jan 1, 2003
43.422
-0.148
-0.34%
jan 1, 2004
41.112
-2.31
-5.32%
jan 1, 2005
38.924
-2.188
-5.32%
jan 1, 2006
34.664
-4.26
-10.94%
jan 1, 2007
34.174
-0.49
-1.41%
jan 1, 2008
34.195
+0.021
0.06%
jan 1, 2009
30.926
-3.269
-9.56%
jan 1, 2010
42.126
+11.199
36.21%
jan 1, 2011
39.079
-3.047
-7.23%
jan 1, 2012
34.241
-4.838
-12.38%
jan 1, 2013
35.326
+1.086
3.17%
jan 1, 2014
38.098
+2.772
7.85%
jan 1, 2015
40.733
+2.635
6.92%
jan 1, 2016
51.838
+11.105
27.26%
Ranking of countries by current statistics by years


Comments: