29
/
en
AIzaSyAYiBZKx7MnpbEhh9jyipgxe19OcubqV5w
April 1, 2024
209776
New Zealand
NZL
true
2
1
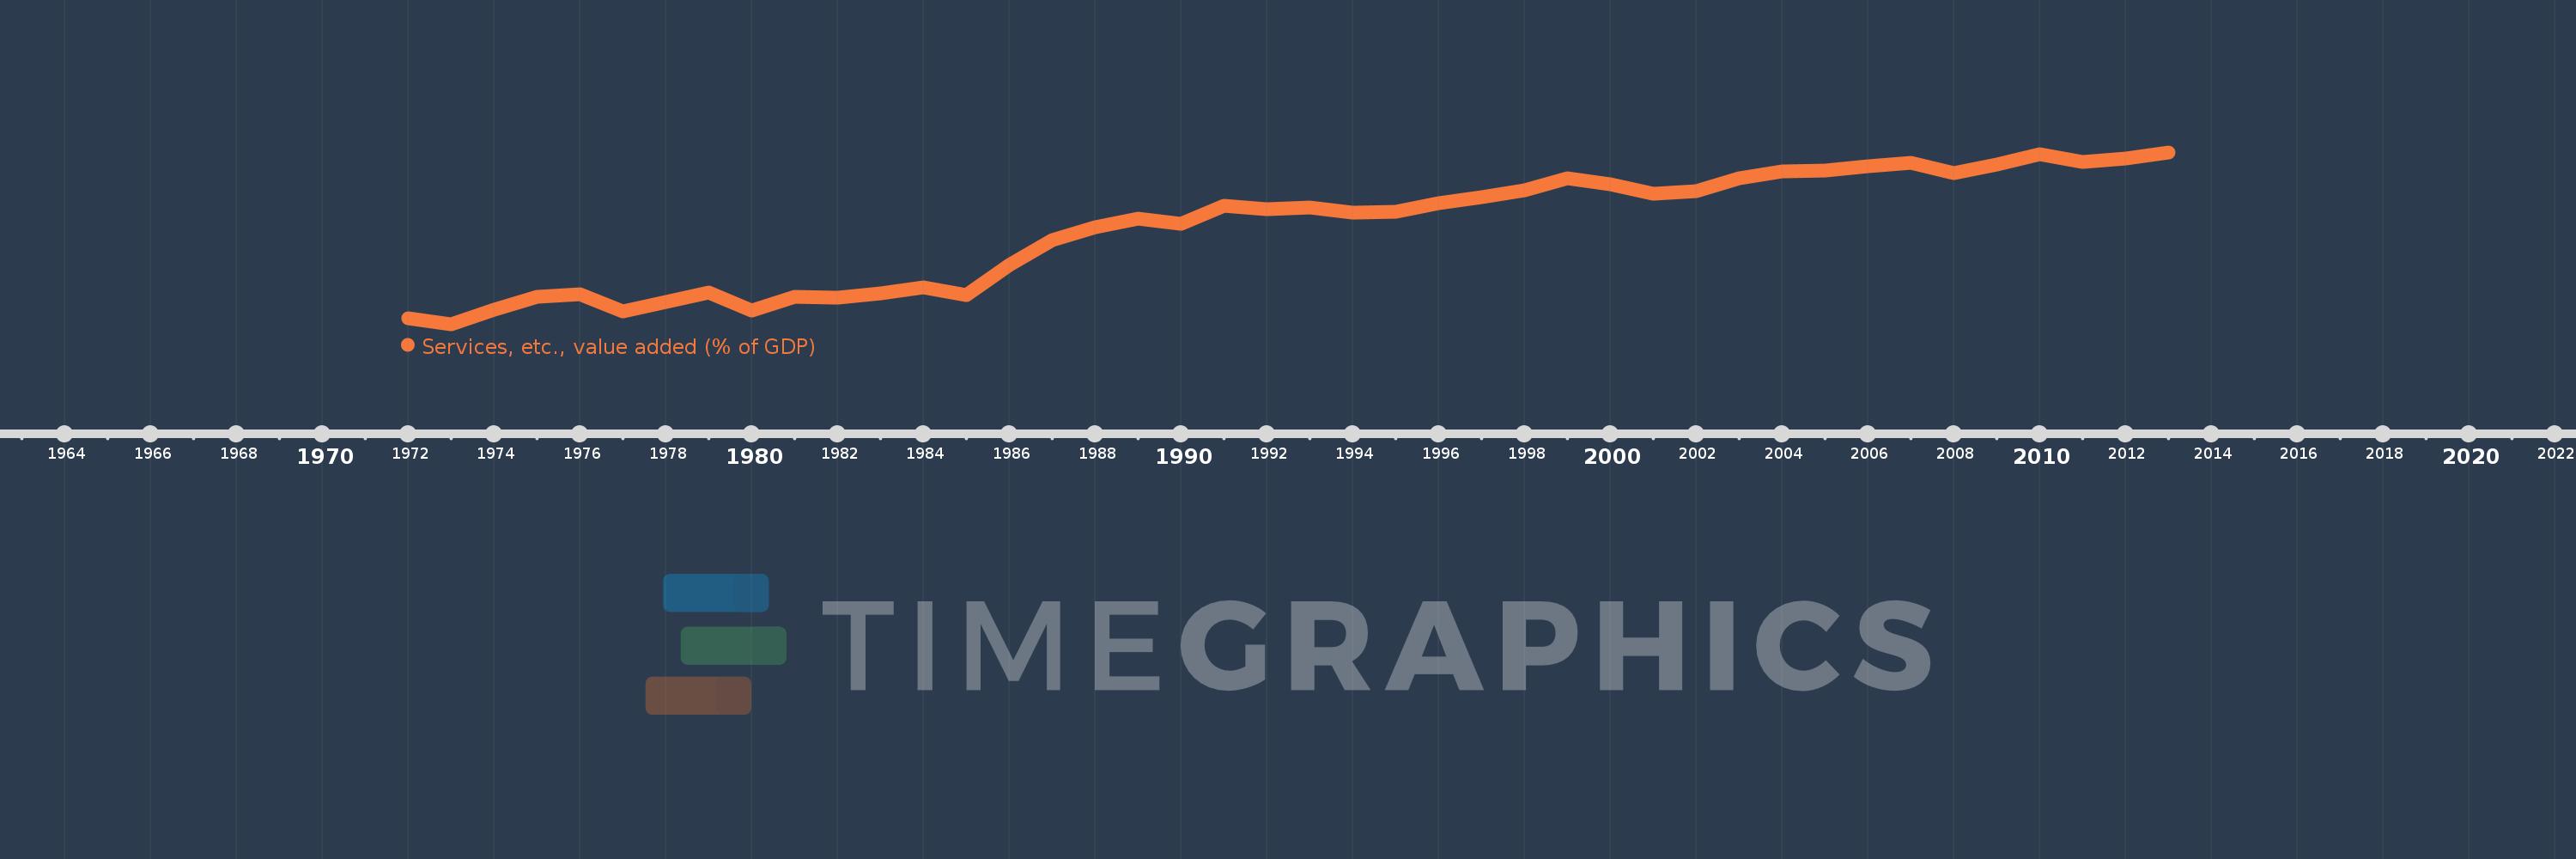
Services, etc., value added (% of GDP)
2013,2012,2011,2010,2009,2008,2007,2006,2005,2004,2003,2002,2001,2000,1999,1998,1997,1996,1995,1994,1993,1992,1991,1990,1989,1988,1987,1986,1985,1984,1983,1982,1981,1980,1979,1978,1977,1976,1975,1974,1973,1972
This statistics in other country:
AfghanistanAlbaniaAlgeriaAndorraAngolaAntigua and BarbudaArab WorldArgentinaArmeniaArubaAustraliaAustriaAzerbaijanBahamas, TheBahrainBangladeshBarbadosBelarusBelgiumBelizeBeninBermudaBhutanBoliviaBosnia and HerzegovinaBotswanaBrazilBrunei DarussalamBulgariaBurkina FasoBurundiCabo VerdeCambodiaCameroonCanadaCaribbean small statesCentral African RepublicCentral Europe and the BalticsChadChileChinaColombiaComorosCongo, Dem. Rep.Congo, Rep.Costa RicaCote d'IvoireCroatiaCubaCyprusCzech RepublicDenmarkDjiboutiDominicaDominican RepublicEarly-demographic dividendEast Asia & PacificEast Asia & Pacific (excluding high income)East Asia & Pacific (IDA & IBRD countries)EcuadorEgypt, Arab Rep.El SalvadorEquatorial GuineaEritreaEstoniaEthiopiaEuro areaEurope & Central AsiaEurope & Central Asia (excluding high income)Europe & Central Asia (IDA & IBRD countries)European UnionFaroe IslandsFijiFinlandFragile and conflict affected situationsFranceGabonGambia, TheGeorgiaGermanyGhanaGreeceGrenadaGuatemalaGuineaGuinea-BissauGuyanaHeavily indebted poor countries (HIPC)High incomeHondurasHong Kong SAR, ChinaHungaryIBRD onlyIcelandIDA & IBRD totalIDA blendIDA onlyIDA totalIndiaIndonesiaIran, Islamic Rep.IrelandItalyJamaicaJapanJordanKazakhstanKenyaKiribatiKorea, Rep.KosovoKuwaitKyrgyz RepublicLao PDRLate-demographic dividendLatin America & Caribbean Latin America & Caribbean (excluding high income)Latin America & the Caribbean (IDA & IBRD countries)LatviaLeast developed countries: UN classificationLebanonLesothoLibyaLithuaniaLow & middle incomeLow incomeLower middle incomeLuxembourgMacao SAR, ChinaMacedonia, FYRMadagascarMalawiMalaysiaMaldivesMaliMaltaMarshall IslandsMauritaniaMauritiusMexicoMicronesia, Fed. Sts.Middle East & North AfricaMiddle East & North Africa (excluding high income)Middle East & North Africa (IDA & IBRD countries)Middle incomeMoldovaMongoliaMontenegroMoroccoMozambiqueMyanmarNamibiaNepalNetherlandsNew CaledoniaNew ZealandNicaraguaNigerNigeriaNorth AmericaNorwayOECD membersOmanOther small statesPacific island small statesPakistanPalauPanamaPapua New GuineaParaguayPeruPhilippinesPolandPortugalPost-demographic dividendPre-demographic dividendPuerto RicoQatarRomaniaRussian FederationRwandaSao Tome and PrincipeSaudi ArabiaSenegalSerbiaSeychellesSierra LeoneSingaporeSlovak RepublicSloveniaSmall statesSolomon IslandsSomaliaSouth AfricaSouth AsiaSouth Asia (IDA & IBRD)SpainSri LankaSt. Kitts and NevisSt. LuciaSt. Vincent and the GrenadinesSub-Saharan Africa Sub-Saharan Africa (excluding high income)Sub-Saharan Africa (IDA & IBRD countries)SudanSurinameSwazilandSwedenSwitzerlandSyrian Arab RepublicTajikistanTanzaniaThailandTimor-LesteTogoTongaTrinidad and TobagoTunisiaTurkeyTurkmenistanTuvaluUgandaUkraineUnited KingdomUnited StatesUpper middle incomeUruguayUzbekistanVanuatuVenezuela, RBVietnamWest Bank and GazaWorldYemen, Rep.ZambiaZimbabwe Timeline:
This timeline shows a graph from 1972 to 2013 of New Zealand. No data until 1971. Number of actual observations by date: 42.
Source name:
World Development Indicators
Source organization:
World Bank national accounts data, and OECD National Accounts data files.
Categories, topics:
Economy & Growth
Last updated:
apr 23, 2017
Indicators value changes by year
Minimum:
51.879
jan 1, 1973
Maximum:
70.891
jan 1, 2013
At the date of observation
Value
Absolute change
Change from previous value
jan 1, 1972
52.519
+52.519
0.0%
jan 1, 1973
51.879
-0.64
-1.22%
jan 1, 1974
53.5
+1.621
3.12%
jan 1, 1975
54.916
+1.416
2.65%
jan 1, 1976
55.153
+0.238
0.43%
jan 1, 1977
53.314
-1.839
-3.34%
jan 1, 1978
54.364
+1.05
1.97%
jan 1, 1979
55.402
+1.038
1.91%
jan 1, 1980
53.403
-1.999
-3.61%
jan 1, 1981
54.952
+1.549
2.9%
jan 1, 1982
54.845
-0.107
-0.19%
jan 1, 1983
55.324
+0.479
0.87%
jan 1, 1984
55.968
+0.644
1.16%
jan 1, 1985
55.13
-0.838
-1.5%
jan 1, 1986
58.458
+3.328
6.04%
jan 1, 1987
61.142
+2.684
4.59%
jan 1, 1988
62.582
+1.44
2.36%
jan 1, 1989
63.577
+0.996
1.59%
jan 1, 1990
62.955
-0.622
-0.98%
jan 1, 1991
64.975
+2.02
3.21%
jan 1, 1992
64.628
-0.347
-0.53%
jan 1, 1993
64.836
+0.208
0.32%
jan 1, 1994
64.182
-0.655
-1.01%
jan 1, 1995
64.32
+0.138
0.22%
jan 1, 1996
65.257
+0.937
1.46%
jan 1, 1997
65.962
+0.704
1.08%
jan 1, 1998
66.667
+0.705
1.07%
jan 1, 1999
68.012
+1.345
2.02%
jan 1, 2000
67.396
-0.616
-0.91%
jan 1, 2001
66.354
-1.042
-1.55%
jan 1, 2002
66.644
+0.29
0.44%
jan 1, 2003
68.024
+1.38
2.07%
jan 1, 2004
68.795
+0.771
1.13%
jan 1, 2005
68.841
+0.047
0.07%
jan 1, 2006
69.321
+0.48
0.7%
jan 1, 2007
69.71
+0.389
0.56%
jan 1, 2008
68.617
-1.094
-1.57%
jan 1, 2009
69.514
+0.898
1.31%
jan 1, 2010
70.677
+1.163
1.67%
jan 1, 2011
69.853
-0.823
-1.17%
jan 1, 2012
70.211
+0.358
0.51%
jan 1, 2013
70.891
+0.68
0.97%
Ranking of countries by current statistics by years


Comments: