29
/
en
AIzaSyAYiBZKx7MnpbEhh9jyipgxe19OcubqV5w
April 1, 2024
40343
IDA total
IDA
false
2
1
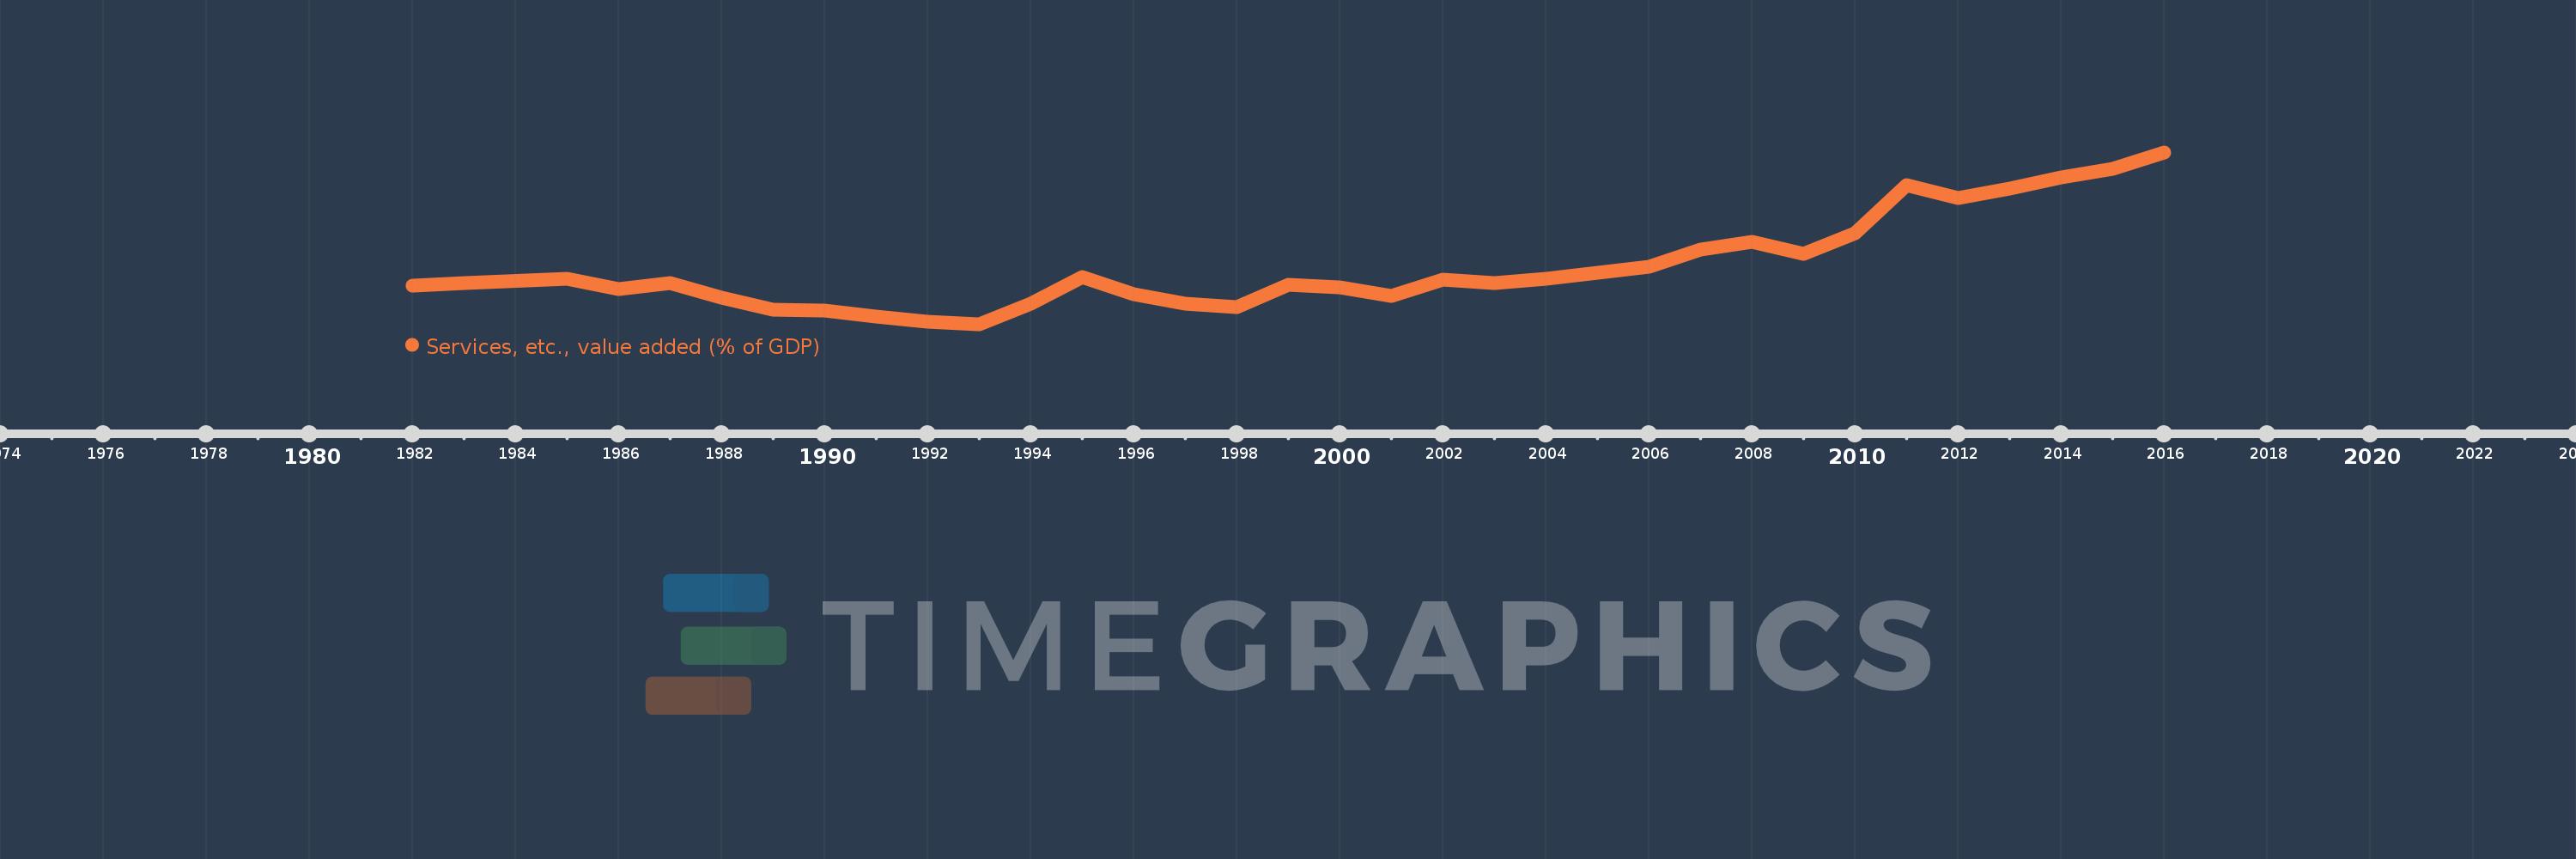
Services, etc., value added (% of GDP)
2016,2015,2014,2013,2012,2011,2010,2009,2008,2007,2006,2005,2004,2003,2002,2001,2000,1999,1998,1997,1996,1995,1994,1993,1992,1991,1990,1989,1988,1987,1986,1985,1983,1982
This statistics in other country:
AfghanistanAlbaniaAlgeriaAndorraAngolaAntigua and BarbudaArab WorldArgentinaArmeniaArubaAustraliaAustriaAzerbaijanBahamas, TheBahrainBangladeshBarbadosBelarusBelgiumBelizeBeninBermudaBhutanBoliviaBosnia and HerzegovinaBotswanaBrazilBrunei DarussalamBulgariaBurkina FasoBurundiCabo VerdeCambodiaCameroonCanadaCaribbean small statesCentral African RepublicCentral Europe and the BalticsChadChileChinaColombiaComorosCongo, Dem. Rep.Congo, Rep.Costa RicaCote d'IvoireCroatiaCubaCyprusCzech RepublicDenmarkDjiboutiDominicaDominican RepublicEarly-demographic dividendEast Asia & PacificEast Asia & Pacific (excluding high income)East Asia & Pacific (IDA & IBRD countries)EcuadorEgypt, Arab Rep.El SalvadorEquatorial GuineaEritreaEstoniaEthiopiaEuro areaEurope & Central AsiaEurope & Central Asia (excluding high income)Europe & Central Asia (IDA & IBRD countries)European UnionFaroe IslandsFijiFinlandFragile and conflict affected situationsFranceGabonGambia, TheGeorgiaGermanyGhanaGreeceGrenadaGuatemalaGuineaGuinea-BissauGuyanaHeavily indebted poor countries (HIPC)High incomeHondurasHong Kong SAR, ChinaHungaryIBRD onlyIcelandIDA & IBRD totalIDA blendIDA onlyIDA totalIndiaIndonesiaIran, Islamic Rep.IrelandItalyJamaicaJapanJordanKazakhstanKenyaKiribatiKorea, Rep.KosovoKuwaitKyrgyz RepublicLao PDRLate-demographic dividendLatin America & Caribbean Latin America & Caribbean (excluding high income)Latin America & the Caribbean (IDA & IBRD countries)LatviaLeast developed countries: UN classificationLebanonLesothoLibyaLithuaniaLow & middle incomeLow incomeLower middle incomeLuxembourgMacao SAR, ChinaMacedonia, FYRMadagascarMalawiMalaysiaMaldivesMaliMaltaMarshall IslandsMauritaniaMauritiusMexicoMicronesia, Fed. Sts.Middle East & North AfricaMiddle East & North Africa (excluding high income)Middle East & North Africa (IDA & IBRD countries)Middle incomeMoldovaMongoliaMontenegroMoroccoMozambiqueMyanmarNamibiaNepalNetherlandsNew CaledoniaNew ZealandNicaraguaNigerNigeriaNorth AmericaNorwayOECD membersOmanOther small statesPacific island small statesPakistanPalauPanamaPapua New GuineaParaguayPeruPhilippinesPolandPortugalPost-demographic dividendPre-demographic dividendPuerto RicoQatarRomaniaRussian FederationRwandaSao Tome and PrincipeSaudi ArabiaSenegalSerbiaSeychellesSierra LeoneSingaporeSlovak RepublicSloveniaSmall statesSolomon IslandsSomaliaSouth AfricaSouth AsiaSouth Asia (IDA & IBRD)SpainSri LankaSt. Kitts and NevisSt. LuciaSt. Vincent and the GrenadinesSub-Saharan Africa Sub-Saharan Africa (excluding high income)Sub-Saharan Africa (IDA & IBRD countries)SudanSurinameSwazilandSwedenSwitzerlandSyrian Arab RepublicTajikistanTanzaniaThailandTimor-LesteTogoTongaTrinidad and TobagoTunisiaTurkeyTurkmenistanTuvaluUgandaUkraineUnited KingdomUnited StatesUpper middle incomeUruguayUzbekistanVanuatuVenezuela, RBVietnamWest Bank and GazaWorldYemen, Rep.ZambiaZimbabwe Timeline:
This timeline shows a graph from 1982 to 2016 of IDA total. No data until 1981. Number of actual observations by date: 34.
Source name:
World Development Indicators
Source organization:
World Bank national accounts data, and OECD National Accounts data files.
Categories, topics:
Economy & Growth
Last updated:
apr 23, 2017
Indicators value changes by year
Minimum:
39.009
jan 1, 1993
Maximum:
51.605
jan 1, 2016
At the date of observation
Value
Absolute change
Change from previous value
jan 1, 1982
41.811
+41.811
0.0%
jan 1, 1983
42.021
+0.21
0.5%
jan 1, 1985
42.325
+0.304
0.72%
jan 1, 1986
41.574
-0.751
-1.77%
jan 1, 1987
41.999
+0.425
1.02%
jan 1, 1988
40.963
-1.036
-2.47%
jan 1, 1989
40.049
-0.913
-2.23%
jan 1, 1990
40.036
-0.014
-0.03%
jan 1, 1991
39.546
-0.49
-1.22%
jan 1, 1992
39.174
-0.372
-0.94%
jan 1, 1993
39.009
-0.165
-0.42%
jan 1, 1994
40.527
+1.517
3.89%
jan 1, 1995
42.471
+1.945
4.8%
jan 1, 1996
41.204
-1.267
-2.98%
jan 1, 1997
40.498
-0.707
-1.71%
jan 1, 1998
40.283
-0.215
-0.53%
jan 1, 1999
41.906
+1.623
4.03%
jan 1, 2000
41.725
-0.181
-0.43%
jan 1, 2001
41.093
-0.631
-1.51%
jan 1, 2002
42.307
+1.214
2.95%
jan 1, 2003
42.018
-0.289
-0.68%
jan 1, 2004
42.359
+0.341
0.81%
jan 1, 2005
42.806
+0.448
1.06%
jan 1, 2006
43.226
+0.419
0.98%
jan 1, 2007
44.495
+1.269
2.94%
jan 1, 2008
45.062
+0.567
1.28%
jan 1, 2009
44.164
-0.898
-1.99%
jan 1, 2010
45.687
+1.523
3.45%
jan 1, 2011
49.189
+3.502
7.66%
jan 1, 2012
48.275
-0.914
-1.86%
jan 1, 2013
48.932
+0.656
1.36%
jan 1, 2014
49.767
+0.835
1.71%
jan 1, 2015
50.389
+0.622
1.25%
jan 1, 2016
51.605
+1.216
2.41%
Ranking of countries by current statistics by years


Comments: