29
/
en
AIzaSyAYiBZKx7MnpbEhh9jyipgxe19OcubqV5w
April 1, 2024
57664
South Asia
SAS
false
2
1
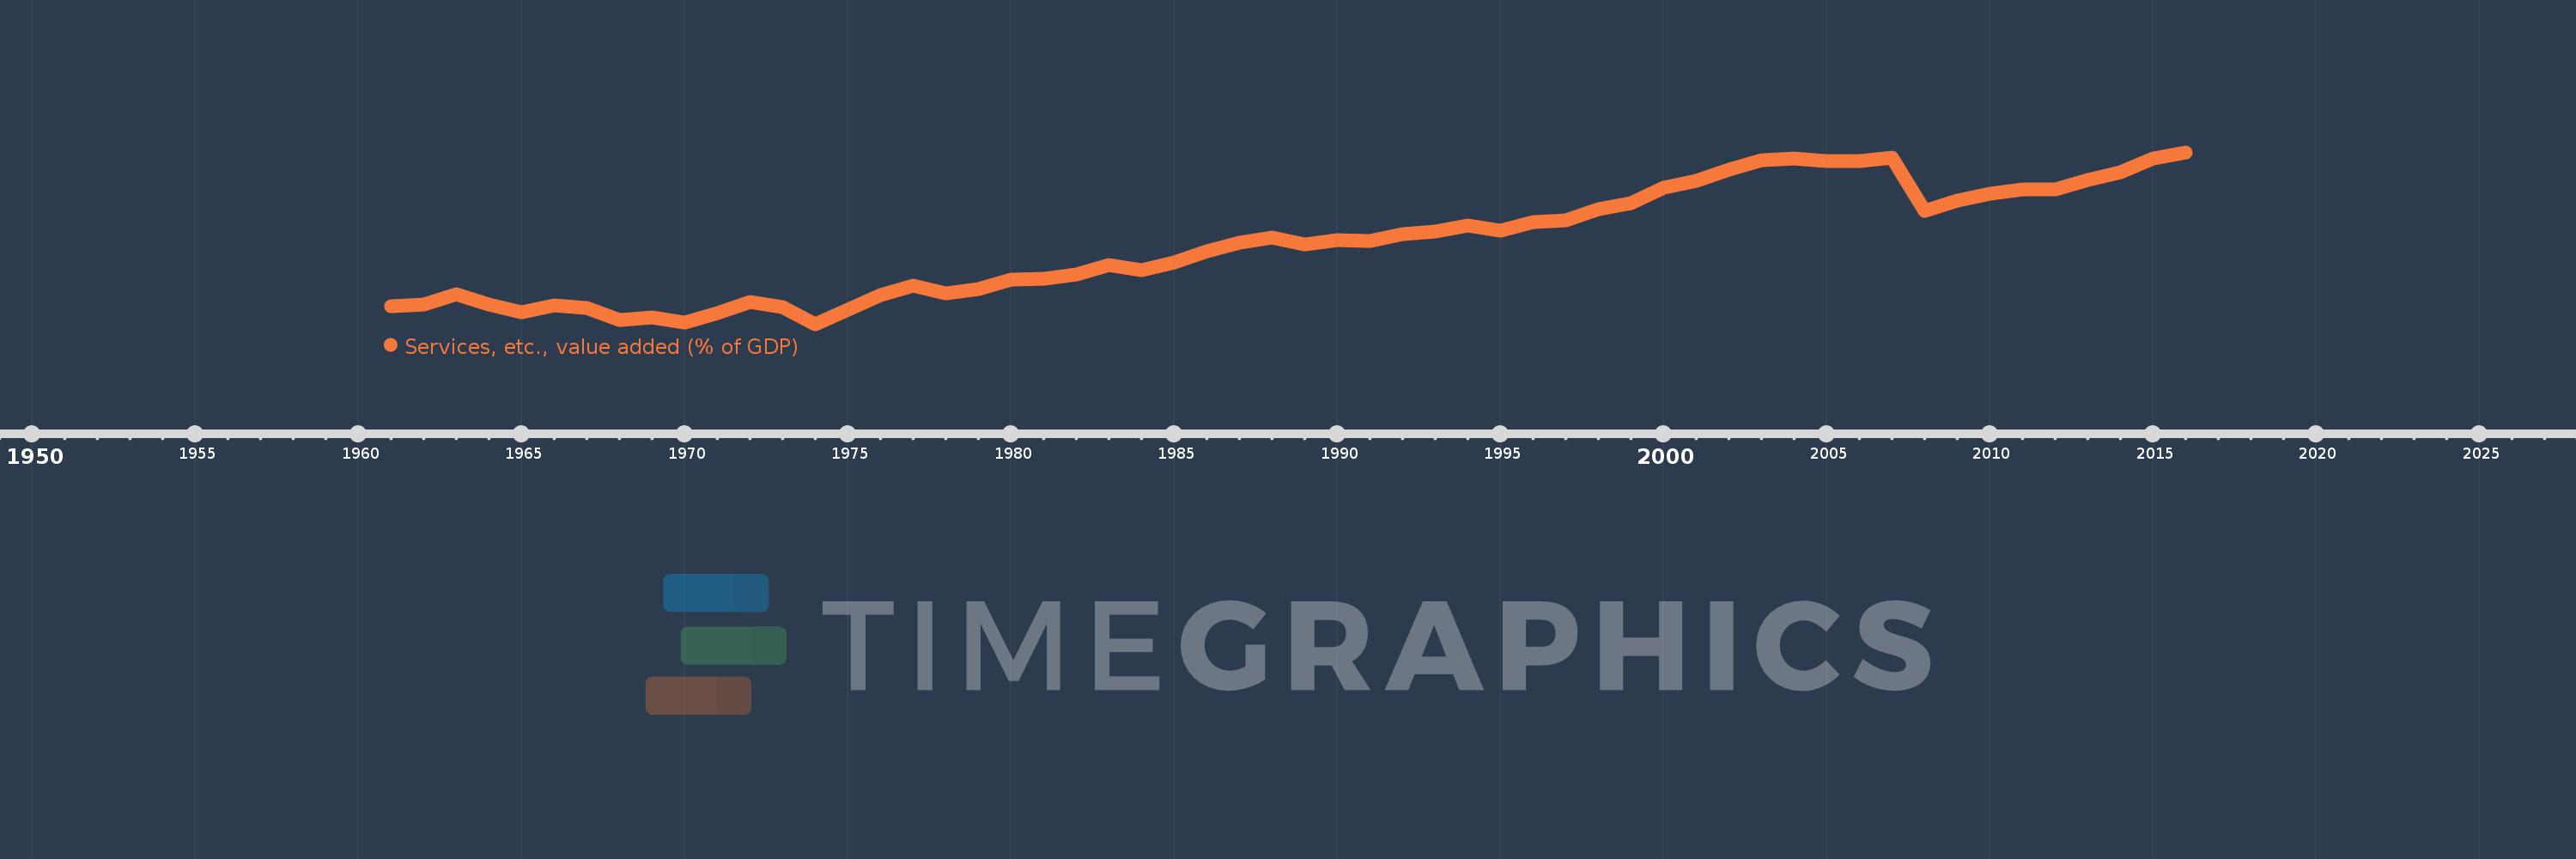
Services, etc., value added (% of GDP)
2016,2015,2014,2013,2012,2011,2010,2009,2008,2007,2006,2005,2004,2003,2002,2001,2000,1999,1998,1997,1996,1995,1994,1993,1992,1991,1990,1989,1988,1987,1986,1985,1984,1983,1982,1981,1980,1979,1978,1977,1976,1975,1974,1973,1972,1971,1970,1969,1968,1967,1966,1965,1964,1963,1962,1961
This statistics in other country:
AfghanistanAlbaniaAlgeriaAndorraAngolaAntigua and BarbudaArab WorldArgentinaArmeniaArubaAustraliaAustriaAzerbaijanBahamas, TheBahrainBangladeshBarbadosBelarusBelgiumBelizeBeninBermudaBhutanBoliviaBosnia and HerzegovinaBotswanaBrazilBrunei DarussalamBulgariaBurkina FasoBurundiCabo VerdeCambodiaCameroonCanadaCaribbean small statesCentral African RepublicCentral Europe and the BalticsChadChileChinaColombiaComorosCongo, Dem. Rep.Congo, Rep.Costa RicaCote d'IvoireCroatiaCubaCyprusCzech RepublicDenmarkDjiboutiDominicaDominican RepublicEarly-demographic dividendEast Asia & PacificEast Asia & Pacific (excluding high income)East Asia & Pacific (IDA & IBRD countries)EcuadorEgypt, Arab Rep.El SalvadorEquatorial GuineaEritreaEstoniaEthiopiaEuro areaEurope & Central AsiaEurope & Central Asia (excluding high income)Europe & Central Asia (IDA & IBRD countries)European UnionFaroe IslandsFijiFinlandFragile and conflict affected situationsFranceGabonGambia, TheGeorgiaGermanyGhanaGreeceGrenadaGuatemalaGuineaGuinea-BissauGuyanaHeavily indebted poor countries (HIPC)High incomeHondurasHong Kong SAR, ChinaHungaryIBRD onlyIcelandIDA & IBRD totalIDA blendIDA onlyIDA totalIndiaIndonesiaIran, Islamic Rep.IrelandItalyJamaicaJapanJordanKazakhstanKenyaKiribatiKorea, Rep.KosovoKuwaitKyrgyz RepublicLao PDRLate-demographic dividendLatin America & Caribbean Latin America & Caribbean (excluding high income)Latin America & the Caribbean (IDA & IBRD countries)LatviaLeast developed countries: UN classificationLebanonLesothoLibyaLithuaniaLow & middle incomeLow incomeLower middle incomeLuxembourgMacao SAR, ChinaMacedonia, FYRMadagascarMalawiMalaysiaMaldivesMaliMaltaMarshall IslandsMauritaniaMauritiusMexicoMicronesia, Fed. Sts.Middle East & North AfricaMiddle East & North Africa (excluding high income)Middle East & North Africa (IDA & IBRD countries)Middle incomeMoldovaMongoliaMontenegroMoroccoMozambiqueMyanmarNamibiaNepalNetherlandsNew CaledoniaNew ZealandNicaraguaNigerNigeriaNorth AmericaNorwayOECD membersOmanOther small statesPacific island small statesPakistanPalauPanamaPapua New GuineaParaguayPeruPhilippinesPolandPortugalPost-demographic dividendPre-demographic dividendPuerto RicoQatarRomaniaRussian FederationRwandaSao Tome and PrincipeSaudi ArabiaSenegalSerbiaSeychellesSierra LeoneSingaporeSlovak RepublicSloveniaSmall statesSolomon IslandsSomaliaSouth AfricaSouth AsiaSouth Asia (IDA & IBRD)SpainSri LankaSt. Kitts and NevisSt. LuciaSt. Vincent and the GrenadinesSub-Saharan Africa Sub-Saharan Africa (excluding high income)Sub-Saharan Africa (IDA & IBRD countries)SudanSurinameSwazilandSwedenSwitzerlandSyrian Arab RepublicTajikistanTanzaniaThailandTimor-LesteTogoTongaTrinidad and TobagoTunisiaTurkeyTurkmenistanTuvaluUgandaUkraineUnited KingdomUnited StatesUpper middle incomeUruguayUzbekistanVanuatuVenezuela, RBVietnamWest Bank and GazaWorldYemen, Rep.ZambiaZimbabwe Timeline:
This timeline shows a graph from 1961 to 2016 of South Asia. No data until 1960. Number of actual observations by date: 56.
Source name:
World Development Indicators
Source organization:
World Bank national accounts data, and OECD National Accounts data files.
Categories, topics:
Economy & Growth
Last updated:
apr 23, 2017
Indicators value changes by year
Minimum:
36.639
jan 1, 1974
At the date of observation
Value
Absolute change
Change from previous value
jan 1, 1961
38.463
+38.463
0.0%
jan 1, 1962
38.568
+0.105
0.27%
jan 1, 1963
39.617
+1.049
2.72%
jan 1, 1964
38.634
-0.983
-2.48%
jan 1, 1965
37.872
-0.762
-1.97%
jan 1, 1966
38.501
+0.629
1.66%
jan 1, 1967
38.247
-0.254
-0.66%
jan 1, 1968
37.034
-1.213
-3.17%
jan 1, 1969
37.344
+0.31
0.84%
jan 1, 1970
36.821
-0.523
-1.4%
jan 1, 1971
37.709
+0.888
2.41%
jan 1, 1972
38.819
+1.11
2.94%
jan 1, 1973
38.378
-0.441
-1.14%
jan 1, 1974
36.639
-1.739
-4.53%
jan 1, 1975
38.045
+1.406
3.84%
jan 1, 1976
39.587
+1.543
4.05%
jan 1, 1977
40.528
+0.94
2.38%
jan 1, 1978
39.758
-0.77
-1.9%
jan 1, 1979
40.12
+0.363
0.91%
jan 1, 1980
41.074
+0.954
2.38%
jan 1, 1981
41.205
+0.131
0.32%
jan 1, 1982
41.6
+0.395
0.96%
jan 1, 1983
42.509
+0.909
2.19%
jan 1, 1984
42.064
-0.444
-1.05%
jan 1, 1985
42.762
+0.697
1.66%
jan 1, 1986
43.934
+1.173
2.74%
jan 1, 1987
44.779
+0.844
1.92%
jan 1, 1988
45.292
+0.514
1.15%
jan 1, 1989
44.595
-0.697
-1.54%
jan 1, 1990
45.012
+0.417
0.94%
jan 1, 1991
44.941
-0.071
-0.16%
jan 1, 1992
45.65
+0.709
1.58%
jan 1, 1993
45.88
+0.23
0.5%
jan 1, 1994
46.449
+0.569
1.24%
jan 1, 1995
46.012
-0.437
-0.94%
jan 1, 1996
46.814
+0.802
1.74%
jan 1, 1997
47.021
+0.206
0.44%
jan 1, 1998
48.139
+1.118
2.38%
jan 1, 1999
48.693
+0.554
1.15%
jan 1, 2000
50.237
+1.544
3.17%
jan 1, 2001
50.984
+0.748
1.49%
jan 1, 2002
52.021
+1.036
2.03%
jan 1, 2003
52.993
+0.972
1.87%
jan 1, 2004
53.168
+0.175
0.33%
jan 1, 2005
52.873
-0.295
-0.56%
jan 1, 2006
52.937
+0.064
0.12%
jan 1, 2007
53.247
+0.311
0.59%
jan 1, 2008
47.907
-5.34
-10.03%
jan 1, 2009
48.96
+1.052
2.2%
jan 1, 2010
49.662
+0.702
1.43%
jan 1, 2011
50.096
+0.433
0.87%
jan 1, 2012
50.051
-0.045
-0.09%
jan 1, 2013
50.987
+0.936
1.87%
jan 1, 2014
51.774
+0.787
1.54%
jan 1, 2015
53.191
+1.418
2.74%
jan 1, 2016
53.78
+0.588
1.11%
Ranking of countries by current statistics by years


Comments: