29
/
en
AIzaSyAYiBZKx7MnpbEhh9jyipgxe19OcubqV5w
April 1, 2024
74383
Austria
AUT
true
2
1
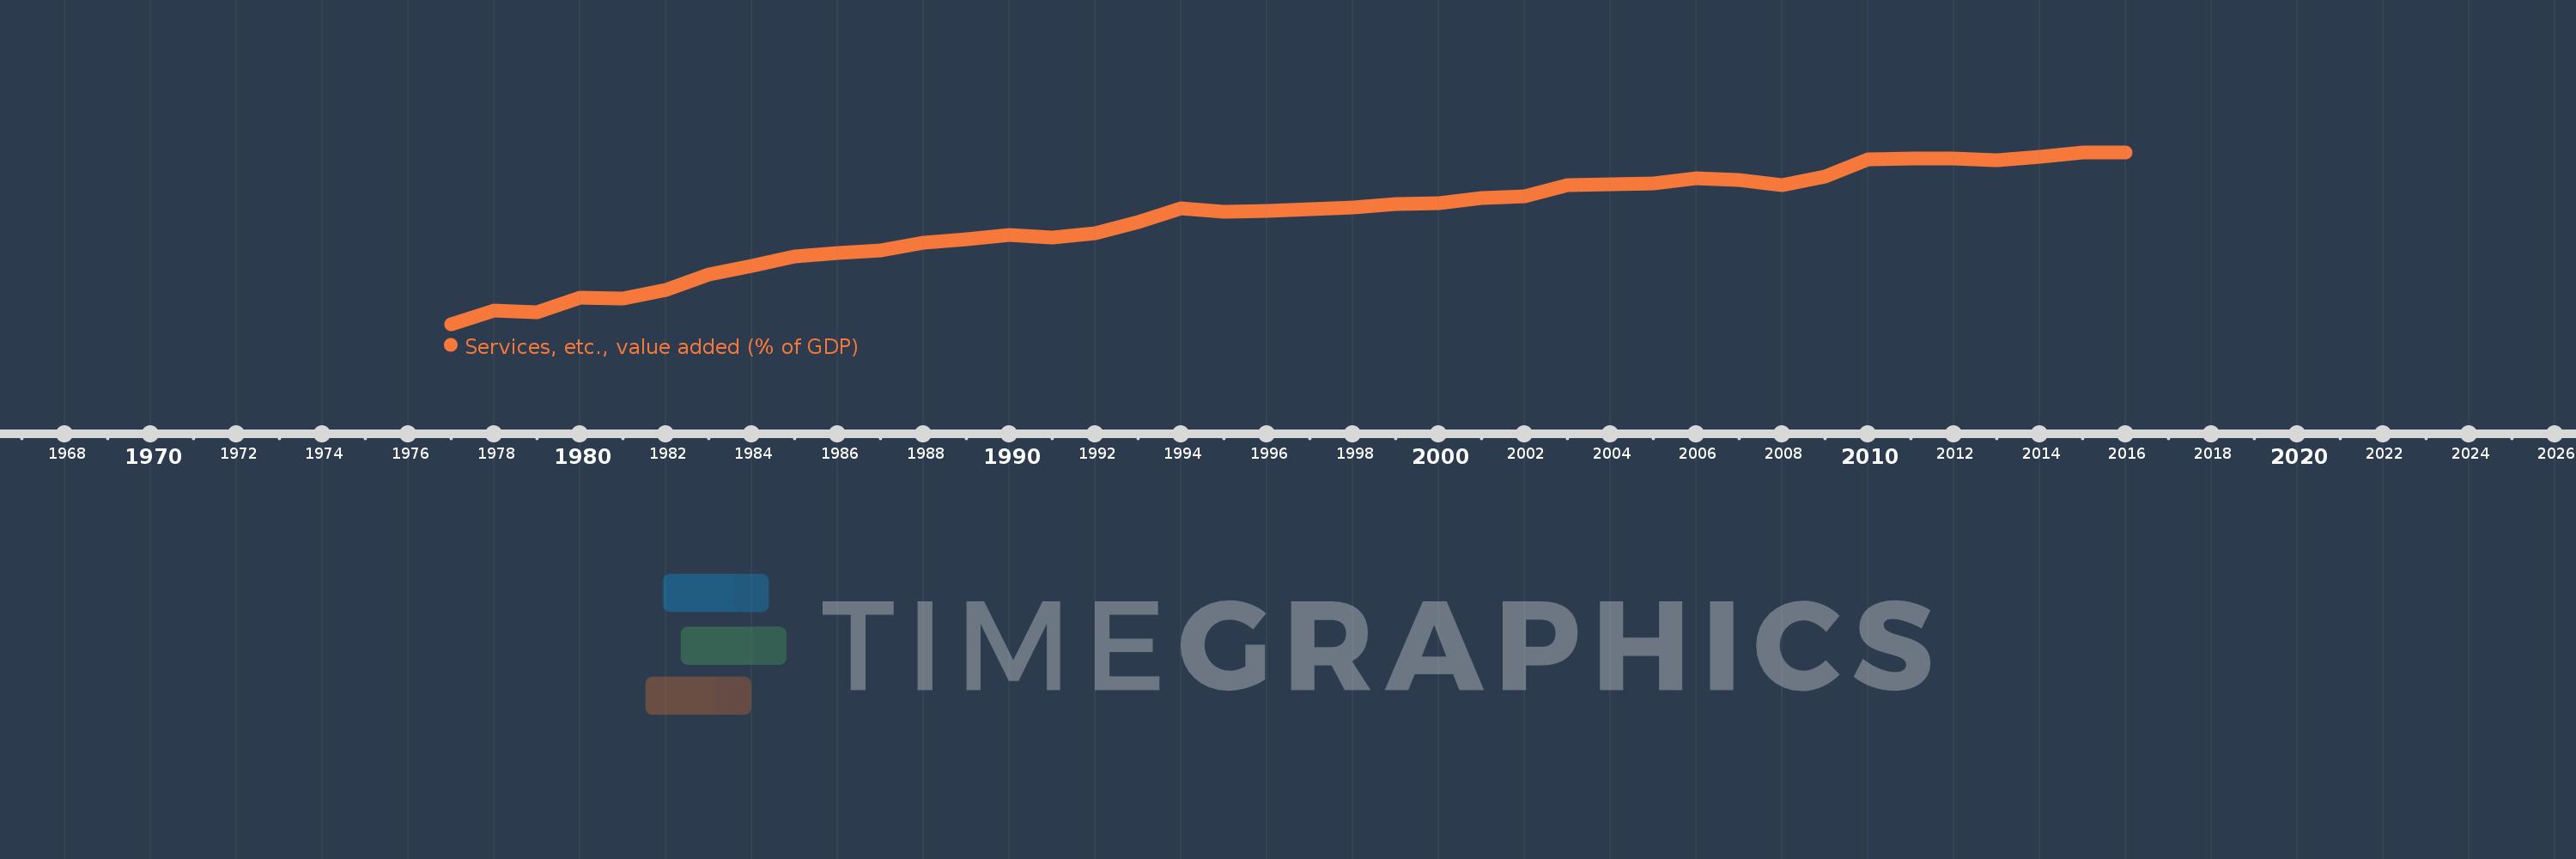
Services, etc., value added (% of GDP)
2016,2015,2014,2013,2012,2011,2010,2009,2008,2007,2006,2005,2004,2003,2002,2001,2000,1999,1998,1997,1996,1995,1994,1993,1992,1991,1990,1989,1988,1987,1986,1985,1984,1983,1982,1981,1980,1979,1978,1977
This statistics in other country:
AfghanistanAlbaniaAlgeriaAndorraAngolaAntigua and BarbudaArab WorldArgentinaArmeniaArubaAustraliaAustriaAzerbaijanBahamas, TheBahrainBangladeshBarbadosBelarusBelgiumBelizeBeninBermudaBhutanBoliviaBosnia and HerzegovinaBotswanaBrazilBrunei DarussalamBulgariaBurkina FasoBurundiCabo VerdeCambodiaCameroonCanadaCaribbean small statesCentral African RepublicCentral Europe and the BalticsChadChileChinaColombiaComorosCongo, Dem. Rep.Congo, Rep.Costa RicaCote d'IvoireCroatiaCubaCyprusCzech RepublicDenmarkDjiboutiDominicaDominican RepublicEarly-demographic dividendEast Asia & PacificEast Asia & Pacific (excluding high income)East Asia & Pacific (IDA & IBRD countries)EcuadorEgypt, Arab Rep.El SalvadorEquatorial GuineaEritreaEstoniaEthiopiaEuro areaEurope & Central AsiaEurope & Central Asia (excluding high income)Europe & Central Asia (IDA & IBRD countries)European UnionFaroe IslandsFijiFinlandFragile and conflict affected situationsFranceGabonGambia, TheGeorgiaGermanyGhanaGreeceGrenadaGuatemalaGuineaGuinea-BissauGuyanaHeavily indebted poor countries (HIPC)High incomeHondurasHong Kong SAR, ChinaHungaryIBRD onlyIcelandIDA & IBRD totalIDA blendIDA onlyIDA totalIndiaIndonesiaIran, Islamic Rep.IrelandItalyJamaicaJapanJordanKazakhstanKenyaKiribatiKorea, Rep.KosovoKuwaitKyrgyz RepublicLao PDRLate-demographic dividendLatin America & Caribbean Latin America & Caribbean (excluding high income)Latin America & the Caribbean (IDA & IBRD countries)LatviaLeast developed countries: UN classificationLebanonLesothoLibyaLithuaniaLow & middle incomeLow incomeLower middle incomeLuxembourgMacao SAR, ChinaMacedonia, FYRMadagascarMalawiMalaysiaMaldivesMaliMaltaMarshall IslandsMauritaniaMauritiusMexicoMicronesia, Fed. Sts.Middle East & North AfricaMiddle East & North Africa (excluding high income)Middle East & North Africa (IDA & IBRD countries)Middle incomeMoldovaMongoliaMontenegroMoroccoMozambiqueMyanmarNamibiaNepalNetherlandsNew CaledoniaNew ZealandNicaraguaNigerNigeriaNorth AmericaNorwayOECD membersOmanOther small statesPacific island small statesPakistanPalauPanamaPapua New GuineaParaguayPeruPhilippinesPolandPortugalPost-demographic dividendPre-demographic dividendPuerto RicoQatarRomaniaRussian FederationRwandaSao Tome and PrincipeSaudi ArabiaSenegalSerbiaSeychellesSierra LeoneSingaporeSlovak RepublicSloveniaSmall statesSolomon IslandsSomaliaSouth AfricaSouth AsiaSouth Asia (IDA & IBRD)SpainSri LankaSt. Kitts and NevisSt. LuciaSt. Vincent and the GrenadinesSub-Saharan Africa Sub-Saharan Africa (excluding high income)Sub-Saharan Africa (IDA & IBRD countries)SudanSurinameSwazilandSwedenSwitzerlandSyrian Arab RepublicTajikistanTanzaniaThailandTimor-LesteTogoTongaTrinidad and TobagoTunisiaTurkeyTurkmenistanTuvaluUgandaUkraineUnited KingdomUnited StatesUpper middle incomeUruguayUzbekistanVanuatuVenezuela, RBVietnamWest Bank and GazaWorldYemen, Rep.ZambiaZimbabwe Timeline:
This timeline shows a graph from 1977 to 2016 of Austria. No data until 1976. Number of actual observations by date: 40.
Source name:
World Development Indicators
Source organization:
World Bank national accounts data, and OECD National Accounts data files.
Categories, topics:
Economy & Growth
Last updated:
apr 23, 2017
Indicators value changes by year
Maximum:
70.369
jan 1, 2016
At the date of observation
Value
Absolute change
Change from previous value
jan 1, 1977
55.81
+55.81
0.0%
jan 1, 1978
56.964
+1.153
2.07%
jan 1, 1979
56.805
-0.158
-0.28%
jan 1, 1980
58.043
+1.237
2.18%
jan 1, 1981
57.963
-0.08
-0.14%
jan 1, 1982
58.742
+0.779
1.34%
jan 1, 1983
60.051
+1.309
2.23%
jan 1, 1984
60.781
+0.73
1.22%
jan 1, 1985
61.58
+0.799
1.32%
jan 1, 1986
61.821
+0.241
0.39%
jan 1, 1987
62.081
+0.261
0.42%
jan 1, 1988
62.695
+0.614
0.99%
jan 1, 1989
63.03
+0.335
0.53%
jan 1, 1990
63.364
+0.335
0.53%
jan 1, 1991
63.121
-0.243
-0.38%
jan 1, 1992
63.506
+0.385
0.61%
jan 1, 1993
64.484
+0.978
1.54%
jan 1, 1994
65.602
+1.118
1.73%
jan 1, 1995
65.312
-0.29
-0.44%
jan 1, 1996
65.434
+0.123
0.19%
jan 1, 1997
65.547
+0.112
0.17%
jan 1, 1998
65.697
+0.15
0.23%
jan 1, 1999
65.991
+0.294
0.45%
jan 1, 2000
66.075
+0.084
0.13%
jan 1, 2001
66.507
+0.432
0.65%
jan 1, 2002
66.641
+0.135
0.2%
jan 1, 2003
67.626
+0.985
1.48%
jan 1, 2004
67.664
+0.037
0.06%
jan 1, 2005
67.732
+0.069
0.1%
jan 1, 2006
68.213
+0.481
0.71%
jan 1, 2007
68.04
-0.173
-0.25%
jan 1, 2008
67.575
-0.465
-0.68%
jan 1, 2009
68.355
+0.78
1.15%
jan 1, 2010
69.785
+1.43
2.09%
jan 1, 2011
69.877
+0.092
0.13%
jan 1, 2012
69.856
-0.021
-0.03%
jan 1, 2013
69.678
-0.178
-0.25%
jan 1, 2014
69.98
+0.301
0.43%
jan 1, 2015
70.357
+0.377
0.54%
jan 1, 2016
70.369
+0.012
0.02%
Ranking of countries by current statistics by years


Comments: