29
/
en
AIzaSyAYiBZKx7MnpbEhh9jyipgxe19OcubqV5w
April 1, 2024
117412
Cyprus
CYP
true
2
1
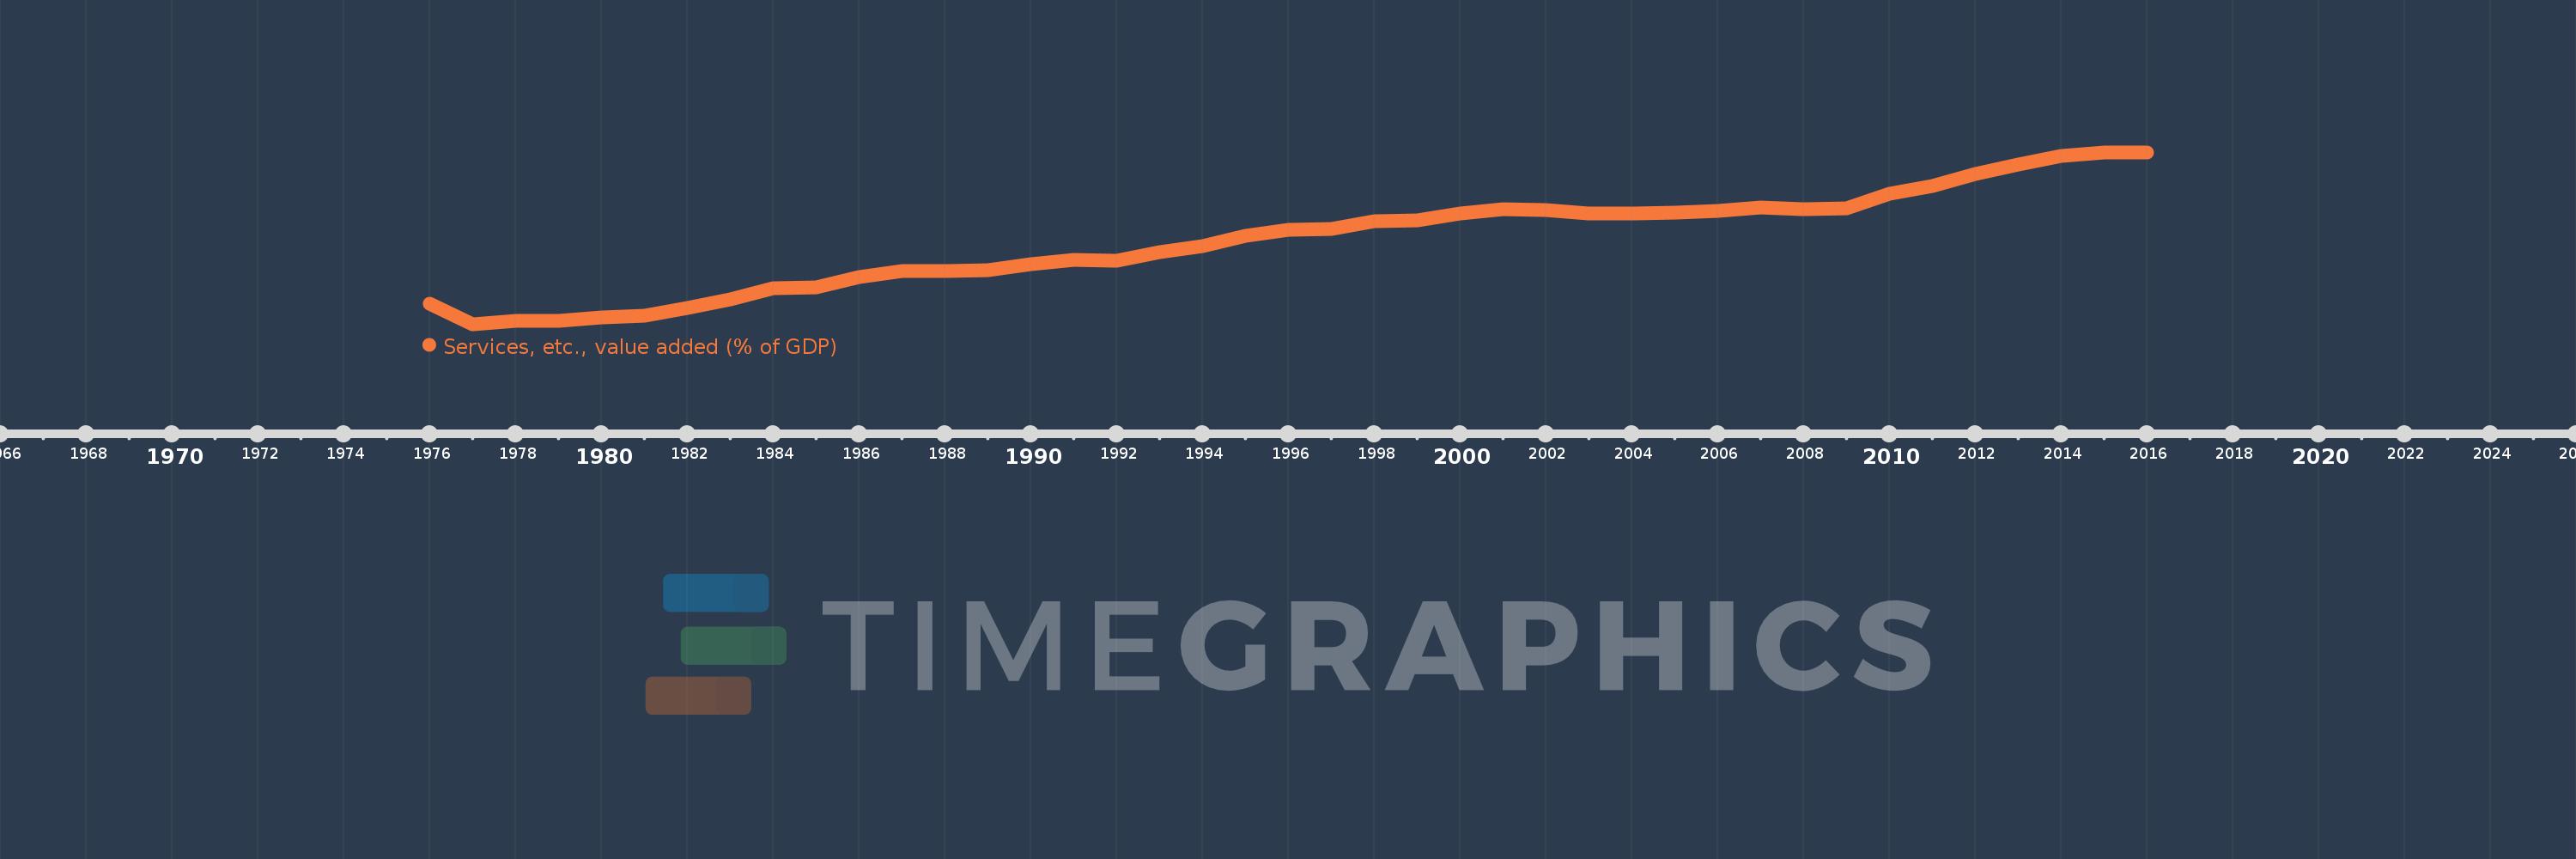
Services, etc., value added (% of GDP)
2016,2015,2014,2013,2012,2011,2010,2009,2008,2007,2006,2005,2004,2003,2002,2001,2000,1999,1998,1997,1996,1995,1994,1993,1992,1991,1990,1989,1988,1987,1986,1985,1984,1983,1982,1981,1980,1979,1978,1977,1976
This statistics in other country:
AfghanistanAlbaniaAlgeriaAndorraAngolaAntigua and BarbudaArab WorldArgentinaArmeniaArubaAustraliaAustriaAzerbaijanBahamas, TheBahrainBangladeshBarbadosBelarusBelgiumBelizeBeninBermudaBhutanBoliviaBosnia and HerzegovinaBotswanaBrazilBrunei DarussalamBulgariaBurkina FasoBurundiCabo VerdeCambodiaCameroonCanadaCaribbean small statesCentral African RepublicCentral Europe and the BalticsChadChileChinaColombiaComorosCongo, Dem. Rep.Congo, Rep.Costa RicaCote d'IvoireCroatiaCubaCyprusCzech RepublicDenmarkDjiboutiDominicaDominican RepublicEarly-demographic dividendEast Asia & PacificEast Asia & Pacific (excluding high income)East Asia & Pacific (IDA & IBRD countries)EcuadorEgypt, Arab Rep.El SalvadorEquatorial GuineaEritreaEstoniaEthiopiaEuro areaEurope & Central AsiaEurope & Central Asia (excluding high income)Europe & Central Asia (IDA & IBRD countries)European UnionFaroe IslandsFijiFinlandFragile and conflict affected situationsFranceGabonGambia, TheGeorgiaGermanyGhanaGreeceGrenadaGuatemalaGuineaGuinea-BissauGuyanaHeavily indebted poor countries (HIPC)High incomeHondurasHong Kong SAR, ChinaHungaryIBRD onlyIcelandIDA & IBRD totalIDA blendIDA onlyIDA totalIndiaIndonesiaIran, Islamic Rep.IrelandItalyJamaicaJapanJordanKazakhstanKenyaKiribatiKorea, Rep.KosovoKuwaitKyrgyz RepublicLao PDRLate-demographic dividendLatin America & Caribbean Latin America & Caribbean (excluding high income)Latin America & the Caribbean (IDA & IBRD countries)LatviaLeast developed countries: UN classificationLebanonLesothoLibyaLithuaniaLow & middle incomeLow incomeLower middle incomeLuxembourgMacao SAR, ChinaMacedonia, FYRMadagascarMalawiMalaysiaMaldivesMaliMaltaMarshall IslandsMauritaniaMauritiusMexicoMicronesia, Fed. Sts.Middle East & North AfricaMiddle East & North Africa (excluding high income)Middle East & North Africa (IDA & IBRD countries)Middle incomeMoldovaMongoliaMontenegroMoroccoMozambiqueMyanmarNamibiaNepalNetherlandsNew CaledoniaNew ZealandNicaraguaNigerNigeriaNorth AmericaNorwayOECD membersOmanOther small statesPacific island small statesPakistanPalauPanamaPapua New GuineaParaguayPeruPhilippinesPolandPortugalPost-demographic dividendPre-demographic dividendPuerto RicoQatarRomaniaRussian FederationRwandaSao Tome and PrincipeSaudi ArabiaSenegalSerbiaSeychellesSierra LeoneSingaporeSlovak RepublicSloveniaSmall statesSolomon IslandsSomaliaSouth AfricaSouth AsiaSouth Asia (IDA & IBRD)SpainSri LankaSt. Kitts and NevisSt. LuciaSt. Vincent and the GrenadinesSub-Saharan Africa Sub-Saharan Africa (excluding high income)Sub-Saharan Africa (IDA & IBRD countries)SudanSurinameSwazilandSwedenSwitzerlandSyrian Arab RepublicTajikistanTanzaniaThailandTimor-LesteTogoTongaTrinidad and TobagoTunisiaTurkeyTurkmenistanTuvaluUgandaUkraineUnited KingdomUnited StatesUpper middle incomeUruguayUzbekistanVanuatuVenezuela, RBVietnamWest Bank and GazaWorldYemen, Rep.ZambiaZimbabwe Timeline:
This timeline shows a graph from 1976 to 2016 of Cyprus. No data until 1975. Number of actual observations by date: 41.
Source name:
World Development Indicators
Source organization:
World Bank national accounts data, and OECD National Accounts data files.
Categories, topics:
Economy & Growth
Last updated:
apr 23, 2017
Indicators value changes by year
Minimum:
55.256
jan 1, 1977
Maximum:
87.197
jan 1, 2015
At the date of observation
Value
Absolute change
Change from previous value
jan 1, 1976
59.105
+59.105
0.0%
jan 1, 1977
55.256
-3.849
-6.51%
jan 1, 1978
55.802
+0.546
0.99%
jan 1, 1979
55.953
+0.15
0.27%
jan 1, 1980
56.542
+0.589
1.05%
jan 1, 1981
56.767
+0.225
0.4%
jan 1, 1982
58.333
+1.566
2.76%
jan 1, 1983
59.869
+1.536
2.63%
jan 1, 1984
62.013
+2.144
3.58%
jan 1, 1985
62.031
+0.018
0.03%
jan 1, 1986
64.02
+1.989
3.21%
jan 1, 1987
65.082
+1.062
1.66%
jan 1, 1988
65.071
-0.011
-0.02%
jan 1, 1989
65.324
+0.253
0.39%
jan 1, 1990
66.494
+1.17
1.79%
jan 1, 1991
67.214
+0.721
1.08%
jan 1, 1992
67.069
-0.145
-0.22%
jan 1, 1993
68.716
+1.647
2.46%
jan 1, 1994
69.707
+0.991
1.44%
jan 1, 1995
71.707
+2.0
2.87%
jan 1, 1996
72.788
+1.081
1.51%
jan 1, 1997
73.044
+0.257
0.35%
jan 1, 1998
74.441
+1.397
1.91%
jan 1, 1999
74.621
+0.179
0.24%
jan 1, 2000
75.83
+1.209
1.62%
jan 1, 2001
76.586
+0.757
1.0%
jan 1, 2002
76.537
-0.049
-0.06%
jan 1, 2003
75.901
-0.636
-0.83%
jan 1, 2004
75.918
+0.017
0.02%
jan 1, 2005
75.958
+0.04
0.05%
jan 1, 2006
76.387
+0.429
0.56%
jan 1, 2007
76.915
+0.528
0.69%
jan 1, 2008
76.574
-0.341
-0.44%
jan 1, 2009
76.853
+0.278
0.36%
jan 1, 2010
79.592
+2.739
3.56%
jan 1, 2011
80.9
+1.308
1.64%
jan 1, 2012
83.231
+2.331
2.88%
jan 1, 2013
84.928
+1.698
2.04%
jan 1, 2014
86.469
+1.541
1.81%
jan 1, 2015
87.197
+0.729
0.84%
jan 1, 2016
87.169
-0.028
-0.03%
Ranking of countries by current statistics by years


Comments: