29
/
en
AIzaSyAYiBZKx7MnpbEhh9jyipgxe19OcubqV5w
April 1, 2024
286589
Zambia
ZMB
true
2
1
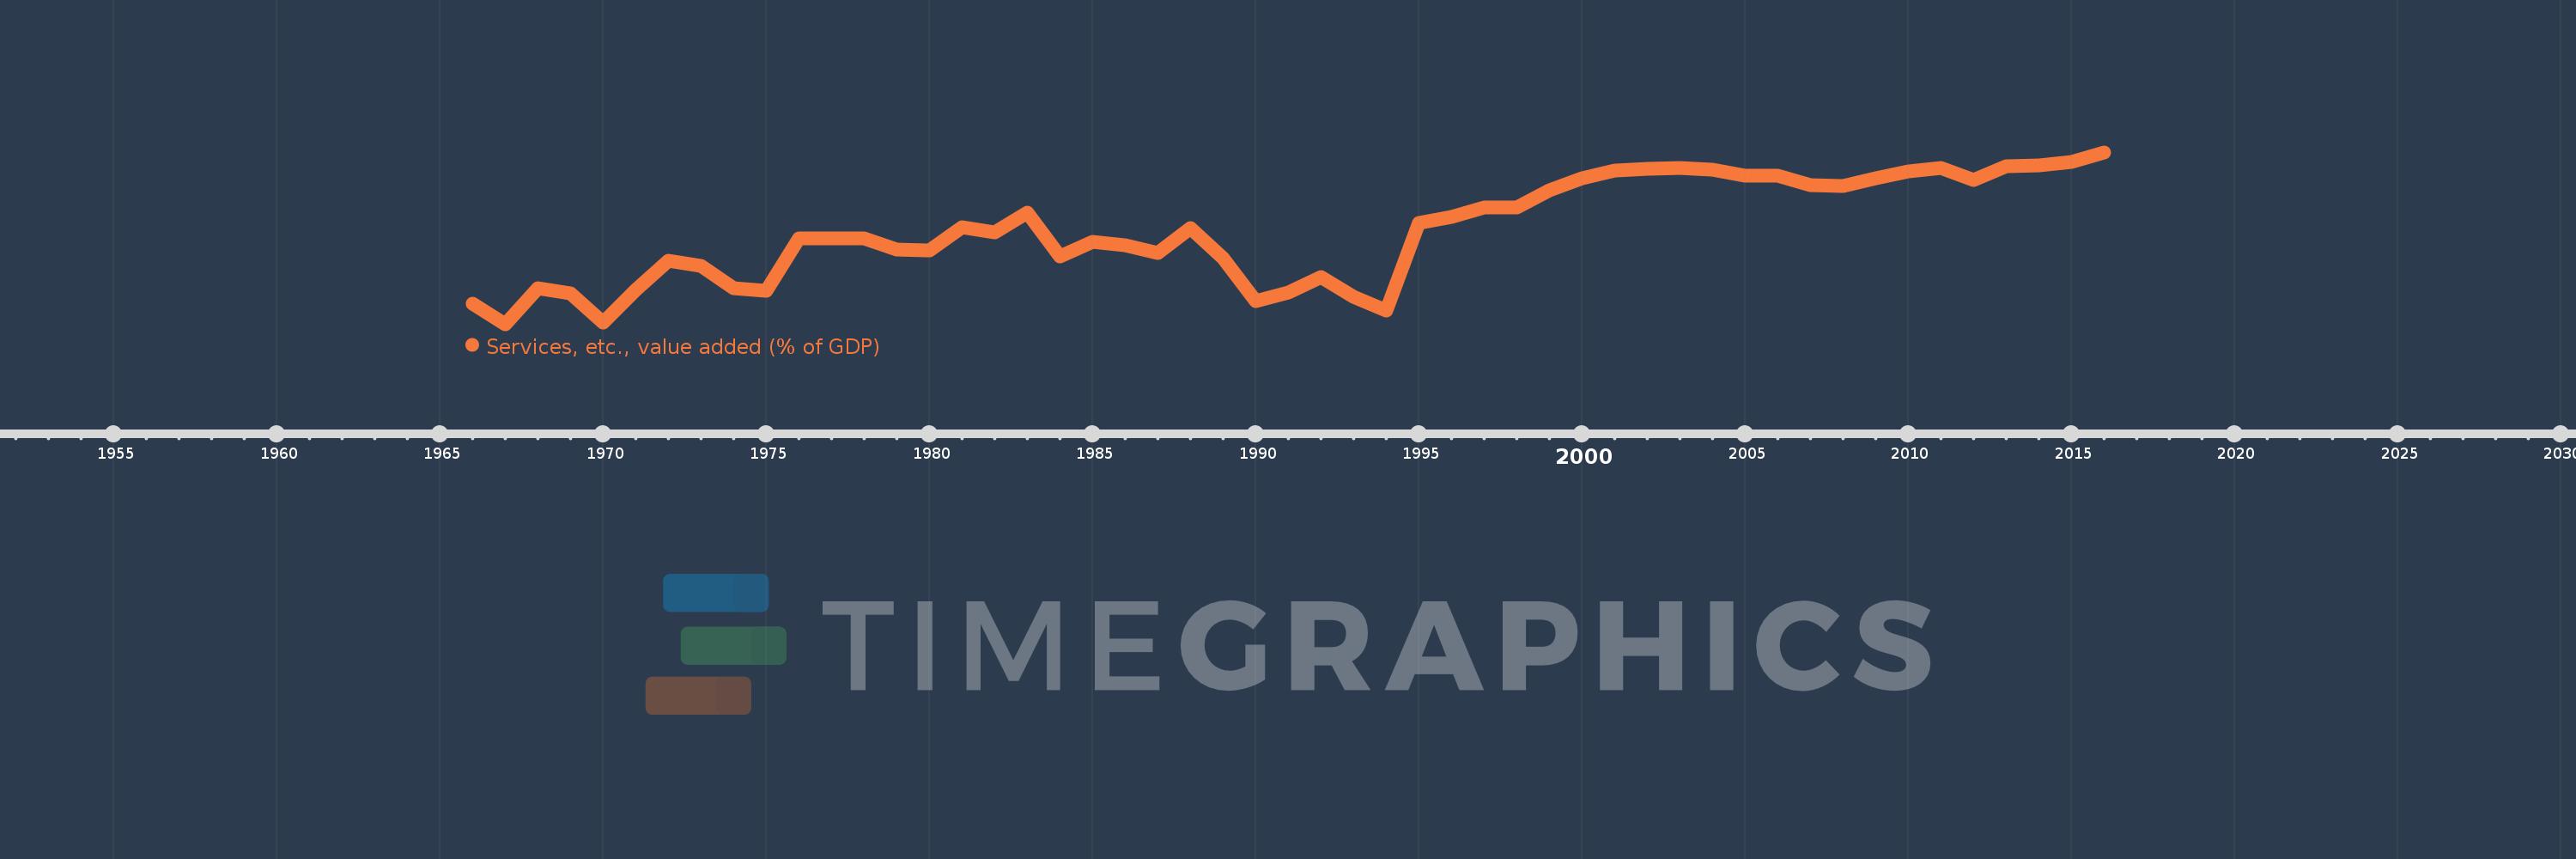
Services, etc., value added (% of GDP)
2016,2015,2014,2013,2012,2011,2010,2009,2008,2007,2006,2005,2004,2003,2002,2001,2000,1999,1998,1997,1996,1995,1994,1993,1992,1991,1990,1989,1988,1987,1986,1985,1984,1983,1982,1981,1980,1979,1978,1977,1976,1975,1974,1973,1972,1971,1970,1969,1968,1967,1966
This statistics in other country:
AfghanistanAlbaniaAlgeriaAndorraAngolaAntigua and BarbudaArab WorldArgentinaArmeniaArubaAustraliaAustriaAzerbaijanBahamas, TheBahrainBangladeshBarbadosBelarusBelgiumBelizeBeninBermudaBhutanBoliviaBosnia and HerzegovinaBotswanaBrazilBrunei DarussalamBulgariaBurkina FasoBurundiCabo VerdeCambodiaCameroonCanadaCaribbean small statesCentral African RepublicCentral Europe and the BalticsChadChileChinaColombiaComorosCongo, Dem. Rep.Congo, Rep.Costa RicaCote d'IvoireCroatiaCubaCyprusCzech RepublicDenmarkDjiboutiDominicaDominican RepublicEarly-demographic dividendEast Asia & PacificEast Asia & Pacific (excluding high income)East Asia & Pacific (IDA & IBRD countries)EcuadorEgypt, Arab Rep.El SalvadorEquatorial GuineaEritreaEstoniaEthiopiaEuro areaEurope & Central AsiaEurope & Central Asia (excluding high income)Europe & Central Asia (IDA & IBRD countries)European UnionFaroe IslandsFijiFinlandFragile and conflict affected situationsFranceGabonGambia, TheGeorgiaGermanyGhanaGreeceGrenadaGuatemalaGuineaGuinea-BissauGuyanaHeavily indebted poor countries (HIPC)High incomeHondurasHong Kong SAR, ChinaHungaryIBRD onlyIcelandIDA & IBRD totalIDA blendIDA onlyIDA totalIndiaIndonesiaIran, Islamic Rep.IrelandItalyJamaicaJapanJordanKazakhstanKenyaKiribatiKorea, Rep.KosovoKuwaitKyrgyz RepublicLao PDRLate-demographic dividendLatin America & Caribbean Latin America & Caribbean (excluding high income)Latin America & the Caribbean (IDA & IBRD countries)LatviaLeast developed countries: UN classificationLebanonLesothoLibyaLithuaniaLow & middle incomeLow incomeLower middle incomeLuxembourgMacao SAR, ChinaMacedonia, FYRMadagascarMalawiMalaysiaMaldivesMaliMaltaMarshall IslandsMauritaniaMauritiusMexicoMicronesia, Fed. Sts.Middle East & North AfricaMiddle East & North Africa (excluding high income)Middle East & North Africa (IDA & IBRD countries)Middle incomeMoldovaMongoliaMontenegroMoroccoMozambiqueMyanmarNamibiaNepalNetherlandsNew CaledoniaNew ZealandNicaraguaNigerNigeriaNorth AmericaNorwayOECD membersOmanOther small statesPacific island small statesPakistanPalauPanamaPapua New GuineaParaguayPeruPhilippinesPolandPortugalPost-demographic dividendPre-demographic dividendPuerto RicoQatarRomaniaRussian FederationRwandaSao Tome and PrincipeSaudi ArabiaSenegalSerbiaSeychellesSierra LeoneSingaporeSlovak RepublicSloveniaSmall statesSolomon IslandsSomaliaSouth AfricaSouth AsiaSouth Asia (IDA & IBRD)SpainSri LankaSt. Kitts and NevisSt. LuciaSt. Vincent and the GrenadinesSub-Saharan Africa Sub-Saharan Africa (excluding high income)Sub-Saharan Africa (IDA & IBRD countries)SudanSurinameSwazilandSwedenSwitzerlandSyrian Arab RepublicTajikistanTanzaniaThailandTimor-LesteTogoTongaTrinidad and TobagoTunisiaTurkeyTurkmenistanTuvaluUgandaUkraineUnited KingdomUnited StatesUpper middle incomeUruguayUzbekistanVanuatuVenezuela, RBVietnamWest Bank and GazaWorldYemen, Rep.ZambiaZimbabwe Timeline:
This timeline shows a graph from 1966 to 2016 of Zambia. No data until 1965. Number of actual observations by date: 51.
Source name:
World Development Indicators
Source organization:
World Bank national accounts data, and OECD National Accounts data files.
Categories, topics:
Economy & Growth
Last updated:
apr 23, 2017
Indicators value changes by year
Minimum:
21.012
jan 1, 1967
Maximum:
59.435
jan 1, 2016
At the date of observation
Value
Absolute change
Change from previous value
jan 1, 1966
25.591
+25.591
0.0%
jan 1, 1967
21.012
-4.578
-17.89%
jan 1, 1968
29.042
+8.03
38.21%
jan 1, 1969
27.92
-1.122
-3.86%
jan 1, 1970
21.294
-6.627
-23.73%
jan 1, 1971
28.607
+7.313
34.34%
jan 1, 1972
35.291
+6.685
23.37%
jan 1, 1973
34.0
-1.291
-3.66%
jan 1, 1974
29.085
-4.915
-14.46%
jan 1, 1975
28.536
-0.549
-1.89%
jan 1, 1976
40.188
+11.651
40.83%
jan 1, 1977
40.17
-0.017
-0.04%
jan 1, 1978
40.243
+0.072
0.18%
jan 1, 1979
37.679
-2.564
-6.37%
jan 1, 1980
37.513
-0.166
-0.44%
jan 1, 1981
42.788
+5.275
14.06%
jan 1, 1982
41.53
-1.258
-2.94%
jan 1, 1983
46.063
+4.533
10.92%
jan 1, 1984
36.08
-9.984
-21.67%
jan 1, 1985
39.507
+3.428
9.5%
jan 1, 1986
38.614
-0.893
-2.26%
jan 1, 1987
37.016
-1.598
-4.14%
jan 1, 1988
42.422
+5.406
14.6%
jan 1, 1989
35.795
-6.627
-15.62%
jan 1, 1990
26.274
-9.522
-26.6%
jan 1, 1991
28.124
+1.85
7.04%
jan 1, 1992
31.566
+3.442
12.24%
jan 1, 1993
27.22
-4.346
-13.77%
jan 1, 1994
24.005
-3.215
-11.81%
jan 1, 1995
43.633
+19.628
81.77%
jan 1, 1996
45.031
+1.398
3.2%
jan 1, 1997
47.185
+2.154
4.78%
jan 1, 1998
47.216
+0.031
0.06%
jan 1, 1999
50.966
+3.75
7.94%
jan 1, 2000
53.668
+2.702
5.3%
jan 1, 2001
55.413
+1.746
3.25%
jan 1, 2002
55.803
+0.389
0.7%
jan 1, 2003
55.894
+0.092
0.16%
jan 1, 2004
55.571
-0.324
-0.58%
jan 1, 2005
54.181
-1.39
-2.5%
jan 1, 2006
54.159
-0.022
-0.04%
jan 1, 2007
52.147
-2.012
-3.71%
jan 1, 2008
51.88
-0.267
-0.51%
jan 1, 2009
53.599
+1.719
3.31%
jan 1, 2010
55.238
+1.638
3.06%
jan 1, 2011
55.9
+0.662
1.2%
jan 1, 2012
53.332
-2.568
-4.59%
jan 1, 2013
56.275
+2.943
5.52%
jan 1, 2014
56.526
+0.251
0.45%
jan 1, 2015
57.394
+0.868
1.54%
jan 1, 2016
59.435
+2.041
3.56%
Ranking of countries by current statistics by years


Comments: