29
/
en
AIzaSyAYiBZKx7MnpbEhh9jyipgxe19OcubqV5w
April 1, 2024
66704
Algeria
DZA
true
2
1
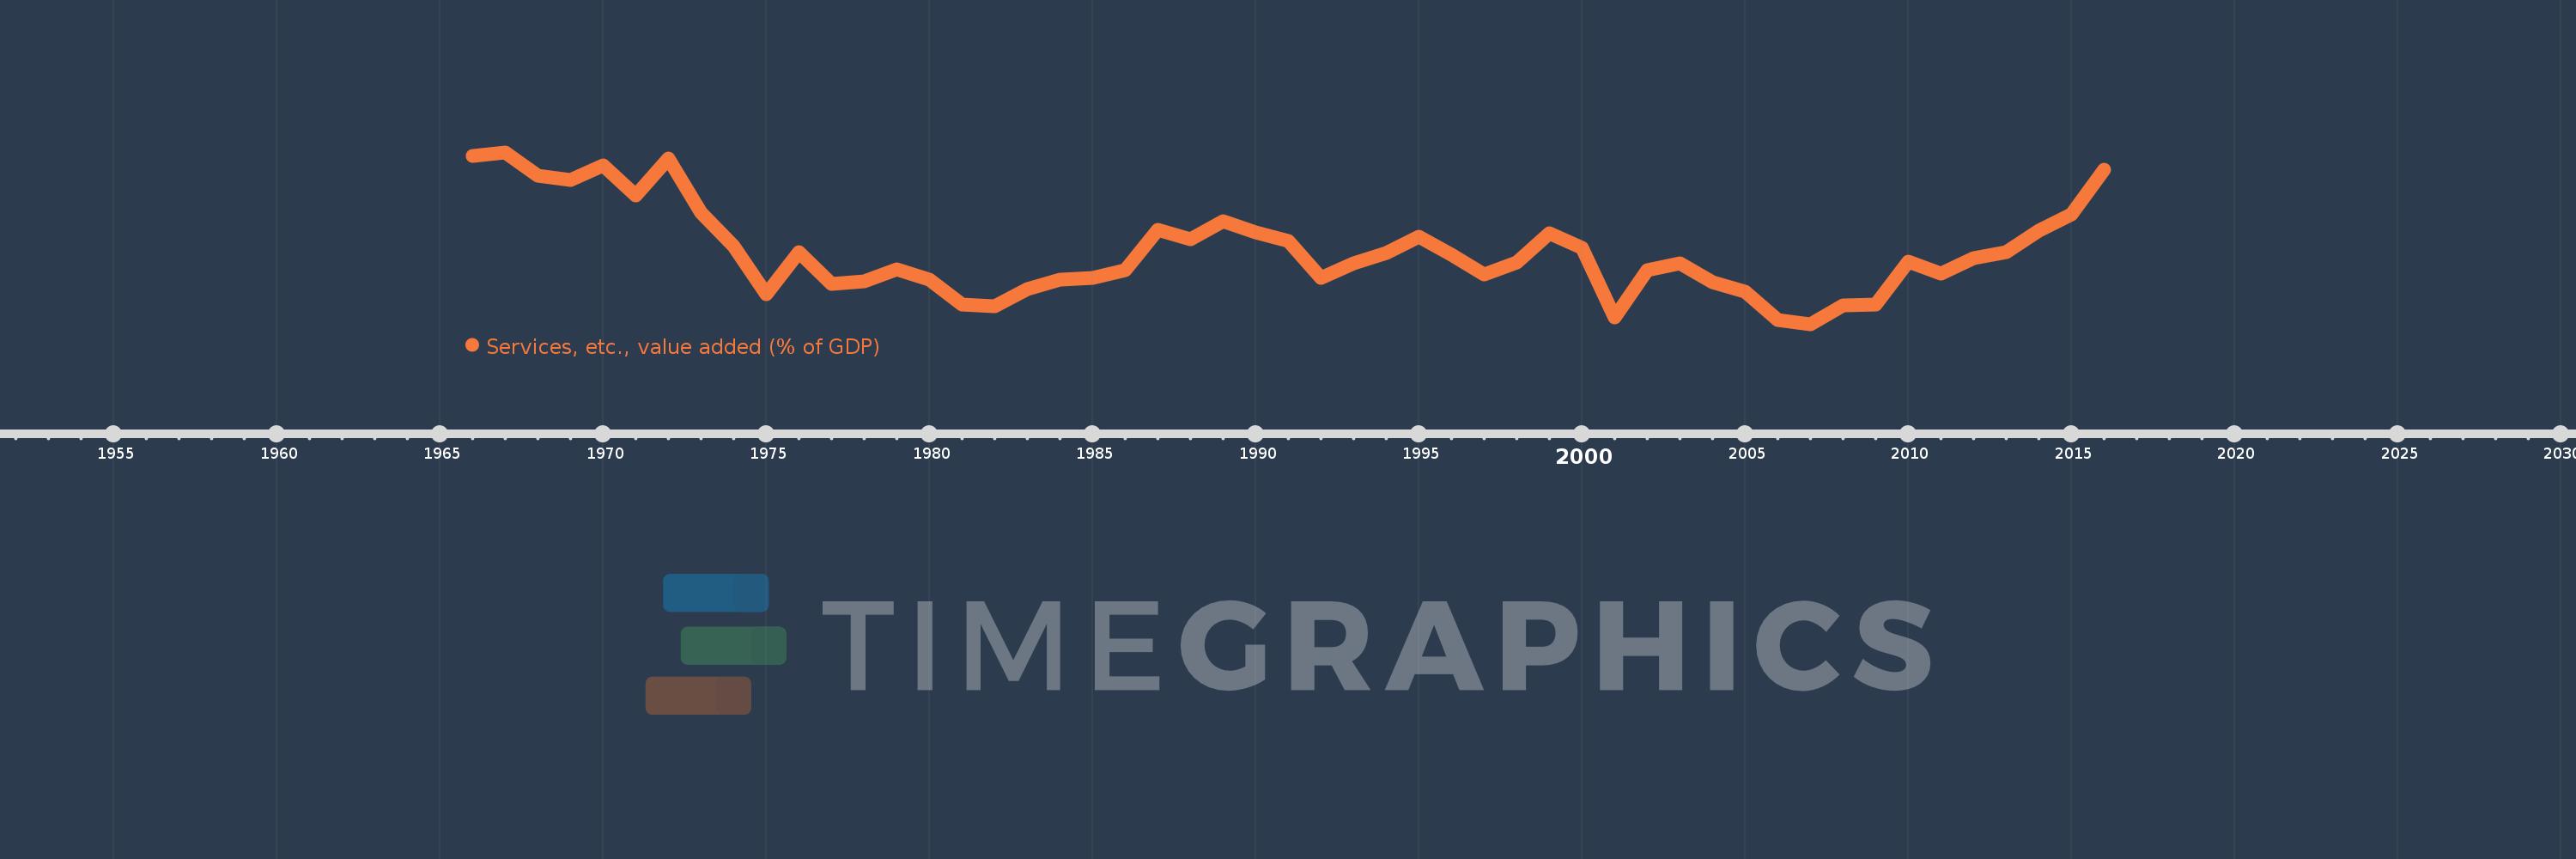
Services, etc., value added (% of GDP)
2016,2015,2014,2013,2012,2011,2010,2009,2008,2007,2006,2005,2004,2003,2002,2001,2000,1999,1998,1997,1996,1995,1994,1993,1992,1991,1990,1989,1988,1987,1986,1985,1984,1983,1982,1981,1980,1979,1978,1977,1976,1975,1974,1973,1972,1971,1970,1969,1968,1967,1966
This statistics in other country:
AfghanistanAlbaniaAlgeriaAndorraAngolaAntigua and BarbudaArab WorldArgentinaArmeniaArubaAustraliaAustriaAzerbaijanBahamas, TheBahrainBangladeshBarbadosBelarusBelgiumBelizeBeninBermudaBhutanBoliviaBosnia and HerzegovinaBotswanaBrazilBrunei DarussalamBulgariaBurkina FasoBurundiCabo VerdeCambodiaCameroonCanadaCaribbean small statesCentral African RepublicCentral Europe and the BalticsChadChileChinaColombiaComorosCongo, Dem. Rep.Congo, Rep.Costa RicaCote d'IvoireCroatiaCubaCyprusCzech RepublicDenmarkDjiboutiDominicaDominican RepublicEarly-demographic dividendEast Asia & PacificEast Asia & Pacific (excluding high income)East Asia & Pacific (IDA & IBRD countries)EcuadorEgypt, Arab Rep.El SalvadorEquatorial GuineaEritreaEstoniaEthiopiaEuro areaEurope & Central AsiaEurope & Central Asia (excluding high income)Europe & Central Asia (IDA & IBRD countries)European UnionFaroe IslandsFijiFinlandFragile and conflict affected situationsFranceGabonGambia, TheGeorgiaGermanyGhanaGreeceGrenadaGuatemalaGuineaGuinea-BissauGuyanaHeavily indebted poor countries (HIPC)High incomeHondurasHong Kong SAR, ChinaHungaryIBRD onlyIcelandIDA & IBRD totalIDA blendIDA onlyIDA totalIndiaIndonesiaIran, Islamic Rep.IrelandItalyJamaicaJapanJordanKazakhstanKenyaKiribatiKorea, Rep.KosovoKuwaitKyrgyz RepublicLao PDRLate-demographic dividendLatin America & Caribbean Latin America & Caribbean (excluding high income)Latin America & the Caribbean (IDA & IBRD countries)LatviaLeast developed countries: UN classificationLebanonLesothoLibyaLithuaniaLow & middle incomeLow incomeLower middle incomeLuxembourgMacao SAR, ChinaMacedonia, FYRMadagascarMalawiMalaysiaMaldivesMaliMaltaMarshall IslandsMauritaniaMauritiusMexicoMicronesia, Fed. Sts.Middle East & North AfricaMiddle East & North Africa (excluding high income)Middle East & North Africa (IDA & IBRD countries)Middle incomeMoldovaMongoliaMontenegroMoroccoMozambiqueMyanmarNamibiaNepalNetherlandsNew CaledoniaNew ZealandNicaraguaNigerNigeriaNorth AmericaNorwayOECD membersOmanOther small statesPacific island small statesPakistanPalauPanamaPapua New GuineaParaguayPeruPhilippinesPolandPortugalPost-demographic dividendPre-demographic dividendPuerto RicoQatarRomaniaRussian FederationRwandaSao Tome and PrincipeSaudi ArabiaSenegalSerbiaSeychellesSierra LeoneSingaporeSlovak RepublicSloveniaSmall statesSolomon IslandsSomaliaSouth AfricaSouth AsiaSouth Asia (IDA & IBRD)SpainSri LankaSt. Kitts and NevisSt. LuciaSt. Vincent and the GrenadinesSub-Saharan Africa Sub-Saharan Africa (excluding high income)Sub-Saharan Africa (IDA & IBRD countries)SudanSurinameSwazilandSwedenSwitzerlandSyrian Arab RepublicTajikistanTanzaniaThailandTimor-LesteTogoTongaTrinidad and TobagoTunisiaTurkeyTurkmenistanTuvaluUgandaUkraineUnited KingdomUnited StatesUpper middle incomeUruguayUzbekistanVanuatuVenezuela, RBVietnamWest Bank and GazaWorldYemen, Rep.ZambiaZimbabwe Timeline:
This timeline shows a graph from 1966 to 2016 of Algeria. No data until 1965. Number of actual observations by date: 51.
Source name:
World Development Indicators
Source organization:
World Bank national accounts data, and OECD National Accounts data files.
Categories, topics:
Economy & Growth
Last updated:
apr 23, 2017
Indicators value changes by year
Maximum:
49.757
jan 1, 1967
At the date of observation
Value
Absolute change
Change from previous value
jan 1, 1966
49.395
+49.395
0.0%
jan 1, 1967
49.757
+0.362
0.73%
jan 1, 1968
47.283
-2.474
-4.97%
jan 1, 1969
46.883
-0.401
-0.85%
jan 1, 1970
48.438
+1.556
3.32%
jan 1, 1971
45.264
-3.175
-6.55%
jan 1, 1972
49.116
+3.852
8.51%
jan 1, 1973
43.451
-5.664
-11.53%
jan 1, 1974
39.971
-3.481
-8.01%
jan 1, 1975
34.936
-5.035
-12.6%
jan 1, 1976
39.369
+4.433
12.69%
jan 1, 1977
35.973
-3.396
-8.63%
jan 1, 1978
36.299
+0.326
0.91%
jan 1, 1979
37.507
+1.208
3.33%
jan 1, 1980
36.463
-1.044
-2.78%
jan 1, 1981
33.839
-2.624
-7.2%
jan 1, 1982
33.711
-0.128
-0.38%
jan 1, 1983
35.487
+1.776
5.27%
jan 1, 1984
36.444
+0.957
2.7%
jan 1, 1985
36.667
+0.222
0.61%
jan 1, 1986
37.439
+0.773
2.11%
jan 1, 1987
41.706
+4.267
11.4%
jan 1, 1988
40.702
-1.005
-2.41%
jan 1, 1989
42.54
+1.838
4.52%
jan 1, 1990
41.427
-1.113
-2.62%
jan 1, 1991
40.472
-0.955
-2.3%
jan 1, 1992
36.674
-3.798
-9.38%
jan 1, 1993
38.157
+1.483
4.04%
jan 1, 1994
39.265
+1.107
2.9%
jan 1, 1995
40.979
+1.714
4.37%
jan 1, 1996
39.102
-1.877
-4.58%
jan 1, 1997
37.003
-2.099
-5.37%
jan 1, 1998
38.211
+1.208
3.26%
jan 1, 1999
41.32
+3.109
8.14%
jan 1, 2000
39.799
-1.521
-3.68%
jan 1, 2001
32.513
-7.285
-18.3%
jan 1, 2002
37.405
+4.892
15.04%
jan 1, 2003
38.166
+0.761
2.03%
jan 1, 2004
36.226
-1.94
-5.08%
jan 1, 2005
35.231
-0.995
-2.75%
jan 1, 2006
32.255
-2.976
-8.45%
jan 1, 2007
31.79
-0.465
-1.44%
jan 1, 2008
33.74
+1.95
6.13%
jan 1, 2009
33.862
+0.122
0.36%
jan 1, 2010
38.329
+4.467
13.19%
jan 1, 2011
37.117
-1.212
-3.16%
jan 1, 2012
38.672
+1.555
4.19%
jan 1, 2013
39.345
+0.673
1.74%
jan 1, 2014
41.56
+2.215
5.63%
jan 1, 2015
43.255
+1.695
4.08%
jan 1, 2016
47.916
+4.661
10.78%
Ranking of countries by current statistics by years


Comments: