29
/
en
AIzaSyAYiBZKx7MnpbEhh9jyipgxe19OcubqV5w
April 1, 2024
87956
Bolivia
BOL
true
2
1
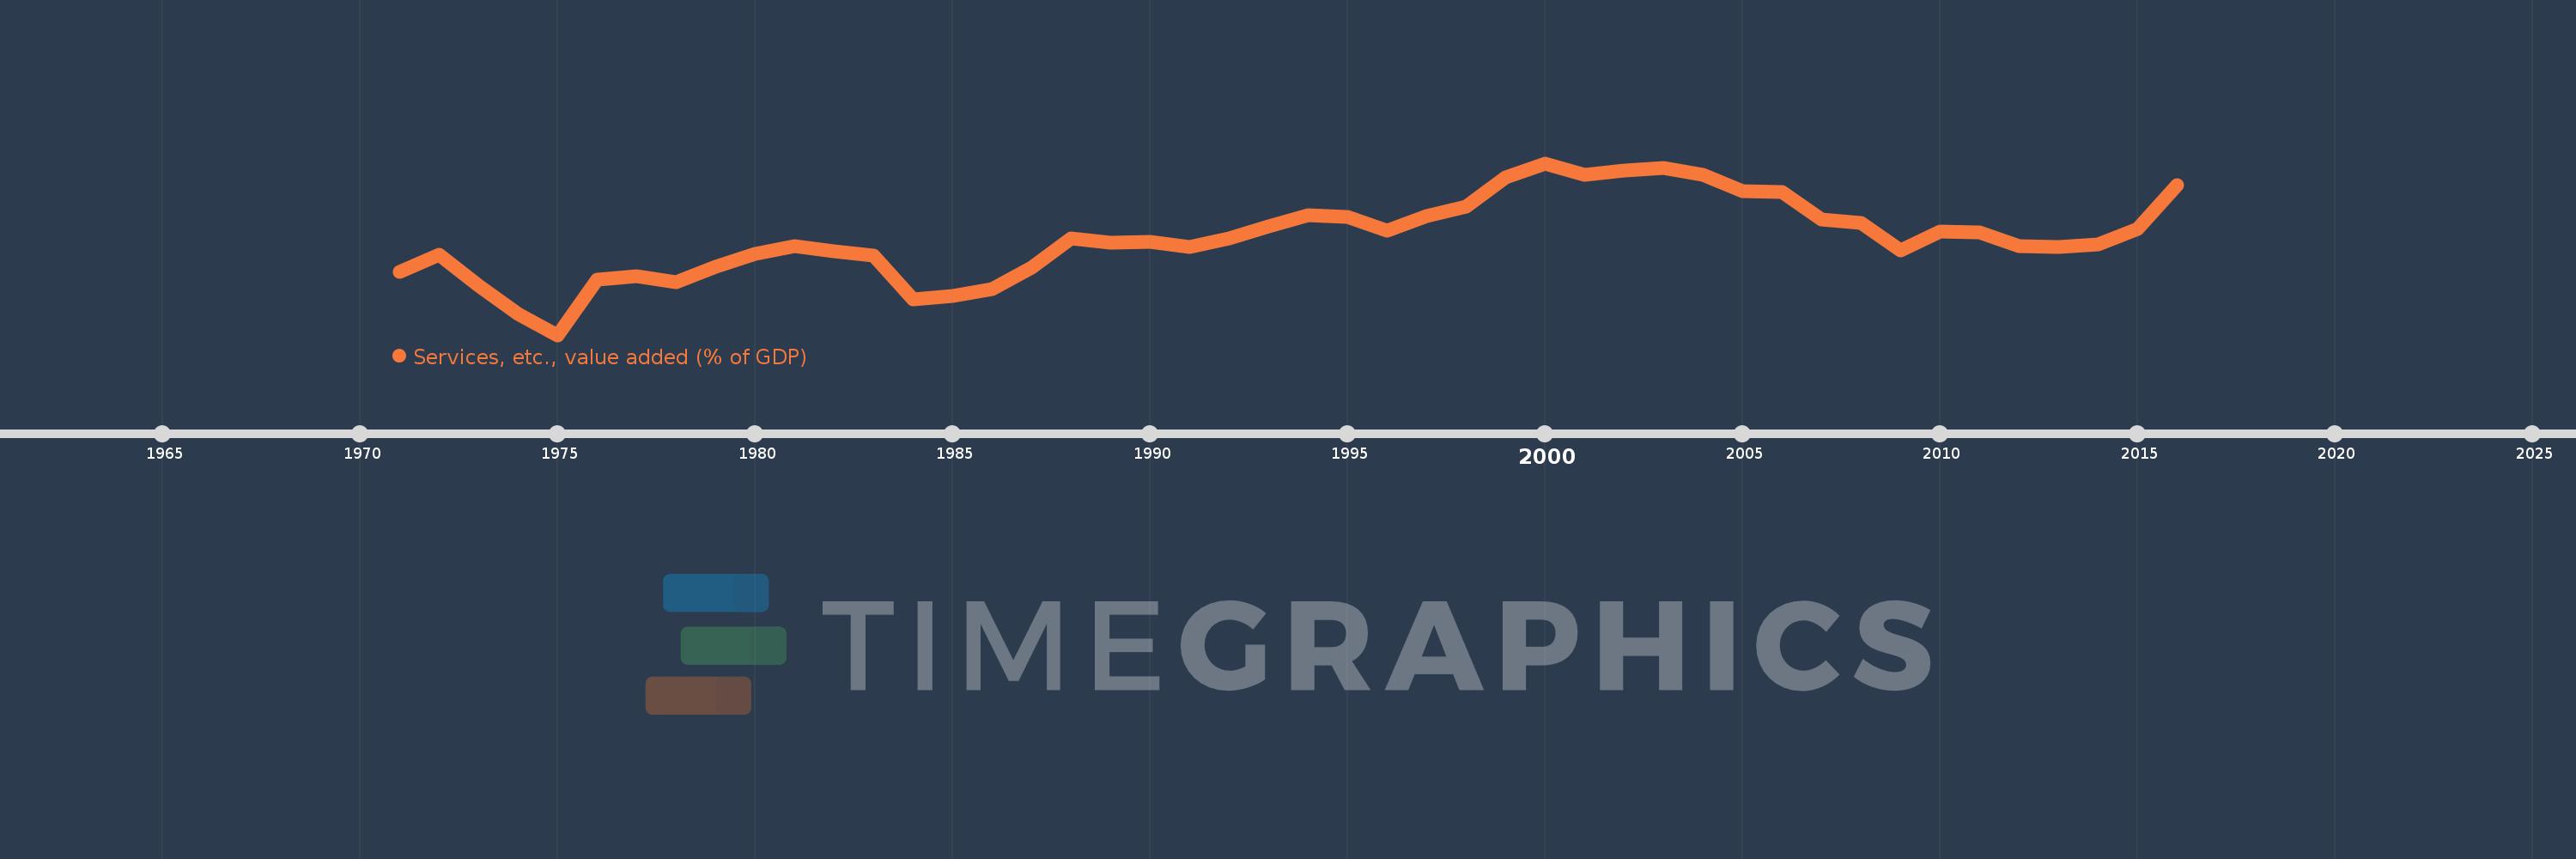
Services, etc., value added (% of GDP)
2016,2015,2014,2013,2012,2011,2010,2009,2008,2007,2006,2005,2004,2003,2002,2001,2000,1999,1998,1997,1996,1995,1994,1993,1992,1991,1990,1989,1988,1987,1986,1985,1984,1983,1982,1981,1980,1979,1978,1977,1976,1975,1974,1973,1972,1971
This statistics in other country:
AfghanistanAlbaniaAlgeriaAndorraAngolaAntigua and BarbudaArab WorldArgentinaArmeniaArubaAustraliaAustriaAzerbaijanBahamas, TheBahrainBangladeshBarbadosBelarusBelgiumBelizeBeninBermudaBhutanBoliviaBosnia and HerzegovinaBotswanaBrazilBrunei DarussalamBulgariaBurkina FasoBurundiCabo VerdeCambodiaCameroonCanadaCaribbean small statesCentral African RepublicCentral Europe and the BalticsChadChileChinaColombiaComorosCongo, Dem. Rep.Congo, Rep.Costa RicaCote d'IvoireCroatiaCubaCyprusCzech RepublicDenmarkDjiboutiDominicaDominican RepublicEarly-demographic dividendEast Asia & PacificEast Asia & Pacific (excluding high income)East Asia & Pacific (IDA & IBRD countries)EcuadorEgypt, Arab Rep.El SalvadorEquatorial GuineaEritreaEstoniaEthiopiaEuro areaEurope & Central AsiaEurope & Central Asia (excluding high income)Europe & Central Asia (IDA & IBRD countries)European UnionFaroe IslandsFijiFinlandFragile and conflict affected situationsFranceGabonGambia, TheGeorgiaGermanyGhanaGreeceGrenadaGuatemalaGuineaGuinea-BissauGuyanaHeavily indebted poor countries (HIPC)High incomeHondurasHong Kong SAR, ChinaHungaryIBRD onlyIcelandIDA & IBRD totalIDA blendIDA onlyIDA totalIndiaIndonesiaIran, Islamic Rep.IrelandItalyJamaicaJapanJordanKazakhstanKenyaKiribatiKorea, Rep.KosovoKuwaitKyrgyz RepublicLao PDRLate-demographic dividendLatin America & Caribbean Latin America & Caribbean (excluding high income)Latin America & the Caribbean (IDA & IBRD countries)LatviaLeast developed countries: UN classificationLebanonLesothoLibyaLithuaniaLow & middle incomeLow incomeLower middle incomeLuxembourgMacao SAR, ChinaMacedonia, FYRMadagascarMalawiMalaysiaMaldivesMaliMaltaMarshall IslandsMauritaniaMauritiusMexicoMicronesia, Fed. Sts.Middle East & North AfricaMiddle East & North Africa (excluding high income)Middle East & North Africa (IDA & IBRD countries)Middle incomeMoldovaMongoliaMontenegroMoroccoMozambiqueMyanmarNamibiaNepalNetherlandsNew CaledoniaNew ZealandNicaraguaNigerNigeriaNorth AmericaNorwayOECD membersOmanOther small statesPacific island small statesPakistanPalauPanamaPapua New GuineaParaguayPeruPhilippinesPolandPortugalPost-demographic dividendPre-demographic dividendPuerto RicoQatarRomaniaRussian FederationRwandaSao Tome and PrincipeSaudi ArabiaSenegalSerbiaSeychellesSierra LeoneSingaporeSlovak RepublicSloveniaSmall statesSolomon IslandsSomaliaSouth AfricaSouth AsiaSouth Asia (IDA & IBRD)SpainSri LankaSt. Kitts and NevisSt. LuciaSt. Vincent and the GrenadinesSub-Saharan Africa Sub-Saharan Africa (excluding high income)Sub-Saharan Africa (IDA & IBRD countries)SudanSurinameSwazilandSwedenSwitzerlandSyrian Arab RepublicTajikistanTanzaniaThailandTimor-LesteTogoTongaTrinidad and TobagoTunisiaTurkeyTurkmenistanTuvaluUgandaUkraineUnited KingdomUnited StatesUpper middle incomeUruguayUzbekistanVanuatuVenezuela, RBVietnamWest Bank and GazaWorldYemen, Rep.ZambiaZimbabwe Timeline:
This timeline shows a graph from 1971 to 2016 of Bolivia. No data until 1970. Number of actual observations by date: 46.
Source name:
World Development Indicators
Source organization:
World Bank national accounts data, and OECD National Accounts data files.
Categories, topics:
Economy & Growth
Last updated:
apr 23, 2017
Indicators value changes by year
Minimum:
40.323
jan 1, 1975
Maximum:
56.246
jan 1, 2000
At the date of observation
Value
Absolute change
Change from previous value
jan 1, 1971
46.195
+46.195
0.0%
jan 1, 1972
47.734
+1.539
3.33%
jan 1, 1973
44.87
-2.865
-6.0%
jan 1, 1974
42.264
-2.605
-5.81%
jan 1, 1975
40.323
-1.942
-4.59%
jan 1, 1976
45.474
+5.151
12.77%
jan 1, 1977
45.746
+0.272
0.6%
jan 1, 1978
45.205
-0.541
-1.18%
jan 1, 1979
46.646
+1.441
3.19%
jan 1, 1980
47.866
+1.22
2.61%
jan 1, 1981
48.553
+0.687
1.43%
jan 1, 1982
48.046
-0.507
-1.04%
jan 1, 1983
47.654
-0.392
-0.82%
jan 1, 1984
43.614
-4.04
-8.48%
jan 1, 1985
43.926
+0.312
0.72%
jan 1, 1986
44.589
+0.663
1.51%
jan 1, 1987
46.541
+1.952
4.38%
jan 1, 1988
49.286
+2.745
5.9%
jan 1, 1989
48.854
-0.432
-0.88%
jan 1, 1990
48.976
+0.122
0.25%
jan 1, 1991
48.494
-0.483
-0.99%
jan 1, 1992
49.259
+0.765
1.58%
jan 1, 1993
50.415
+1.155
2.35%
jan 1, 1994
51.438
+1.023
2.03%
jan 1, 1995
51.299
-0.138
-0.27%
jan 1, 1996
50.003
-1.296
-2.53%
jan 1, 1997
51.346
+1.343
2.69%
jan 1, 1998
52.209
+0.863
1.68%
jan 1, 1999
54.965
+2.756
5.28%
jan 1, 2000
56.246
+1.281
2.33%
jan 1, 2001
55.2
-1.046
-1.86%
jan 1, 2002
55.606
+0.406
0.74%
jan 1, 2003
55.806
+0.2
0.36%
jan 1, 2004
55.19
-0.615
-1.1%
jan 1, 2005
53.651
-1.539
-2.79%
jan 1, 2006
53.594
-0.057
-0.11%
jan 1, 2007
51.042
-2.551
-4.76%
jan 1, 2008
50.734
-0.309
-0.6%
jan 1, 2009
48.174
-2.56
-5.05%
jan 1, 2010
49.927
+1.753
3.64%
jan 1, 2011
49.856
-0.07
-0.14%
jan 1, 2012
48.584
-1.272
-2.55%
jan 1, 2013
48.471
-0.113
-0.23%
jan 1, 2014
48.709
+0.238
0.49%
jan 1, 2015
50.18
+1.471
3.02%
jan 1, 2016
54.182
+4.002
7.97%
Ranking of countries by current statistics by years


Comments: