29
/
en
AIzaSyAYiBZKx7MnpbEhh9jyipgxe19OcubqV5w
April 1, 2024
41076
Late-demographic dividend
LTE
false
2
1
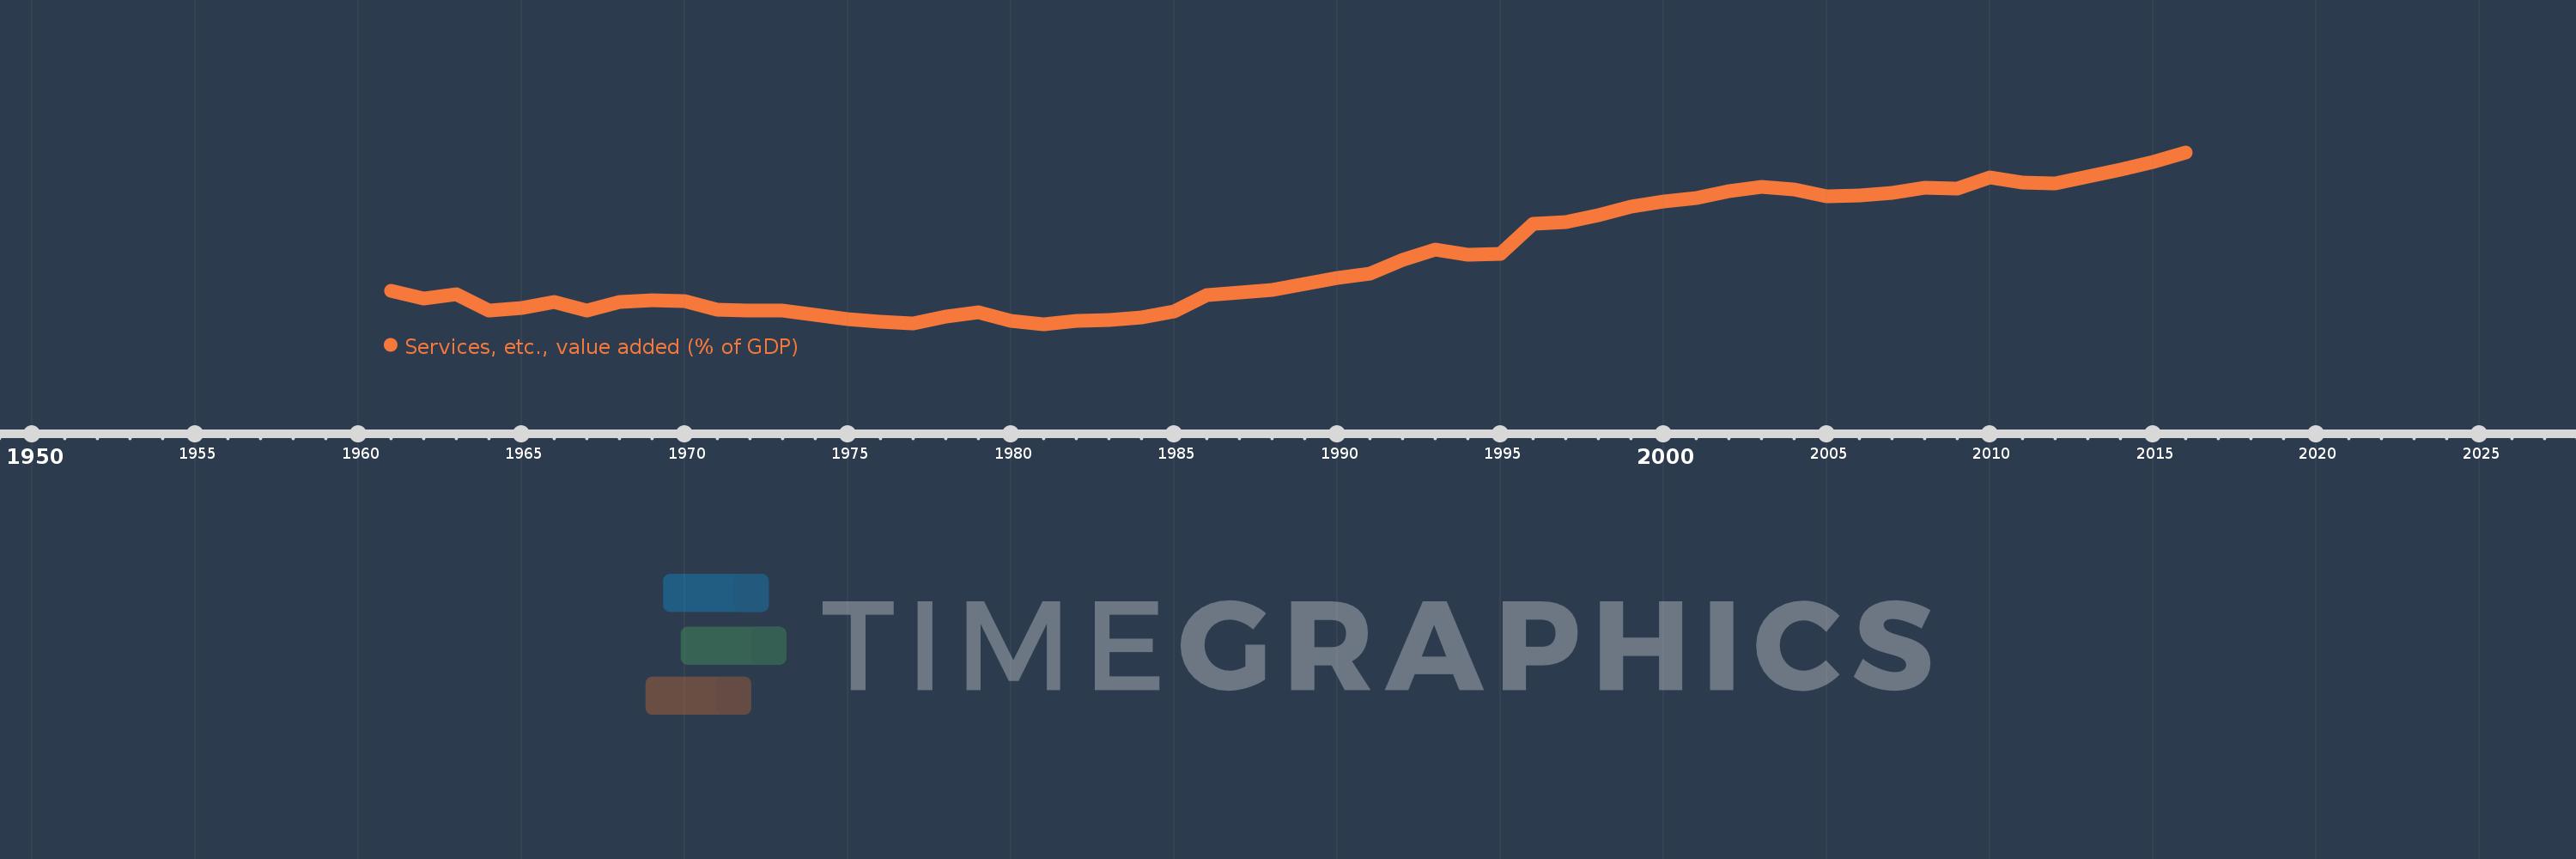
Services, etc., value added (% of GDP)
2016,2015,2014,2013,2012,2011,2010,2009,2008,2007,2006,2005,2004,2003,2002,2001,2000,1999,1998,1997,1996,1995,1994,1993,1992,1991,1990,1989,1988,1987,1986,1985,1984,1983,1982,1981,1980,1979,1978,1977,1976,1975,1974,1973,1972,1971,1970,1969,1968,1967,1966,1965,1964,1963,1962,1961
This statistics in other country:
AfghanistanAlbaniaAlgeriaAndorraAngolaAntigua and BarbudaArab WorldArgentinaArmeniaArubaAustraliaAustriaAzerbaijanBahamas, TheBahrainBangladeshBarbadosBelarusBelgiumBelizeBeninBermudaBhutanBoliviaBosnia and HerzegovinaBotswanaBrazilBrunei DarussalamBulgariaBurkina FasoBurundiCabo VerdeCambodiaCameroonCanadaCaribbean small statesCentral African RepublicCentral Europe and the BalticsChadChileChinaColombiaComorosCongo, Dem. Rep.Congo, Rep.Costa RicaCote d'IvoireCroatiaCubaCyprusCzech RepublicDenmarkDjiboutiDominicaDominican RepublicEarly-demographic dividendEast Asia & PacificEast Asia & Pacific (excluding high income)East Asia & Pacific (IDA & IBRD countries)EcuadorEgypt, Arab Rep.El SalvadorEquatorial GuineaEritreaEstoniaEthiopiaEuro areaEurope & Central AsiaEurope & Central Asia (excluding high income)Europe & Central Asia (IDA & IBRD countries)European UnionFaroe IslandsFijiFinlandFragile and conflict affected situationsFranceGabonGambia, TheGeorgiaGermanyGhanaGreeceGrenadaGuatemalaGuineaGuinea-BissauGuyanaHeavily indebted poor countries (HIPC)High incomeHondurasHong Kong SAR, ChinaHungaryIBRD onlyIcelandIDA & IBRD totalIDA blendIDA onlyIDA totalIndiaIndonesiaIran, Islamic Rep.IrelandItalyJamaicaJapanJordanKazakhstanKenyaKiribatiKorea, Rep.KosovoKuwaitKyrgyz RepublicLao PDRLate-demographic dividendLatin America & Caribbean Latin America & Caribbean (excluding high income)Latin America & the Caribbean (IDA & IBRD countries)LatviaLeast developed countries: UN classificationLebanonLesothoLibyaLithuaniaLow & middle incomeLow incomeLower middle incomeLuxembourgMacao SAR, ChinaMacedonia, FYRMadagascarMalawiMalaysiaMaldivesMaliMaltaMarshall IslandsMauritaniaMauritiusMexicoMicronesia, Fed. Sts.Middle East & North AfricaMiddle East & North Africa (excluding high income)Middle East & North Africa (IDA & IBRD countries)Middle incomeMoldovaMongoliaMontenegroMoroccoMozambiqueMyanmarNamibiaNepalNetherlandsNew CaledoniaNew ZealandNicaraguaNigerNigeriaNorth AmericaNorwayOECD membersOmanOther small statesPacific island small statesPakistanPalauPanamaPapua New GuineaParaguayPeruPhilippinesPolandPortugalPost-demographic dividendPre-demographic dividendPuerto RicoQatarRomaniaRussian FederationRwandaSao Tome and PrincipeSaudi ArabiaSenegalSerbiaSeychellesSierra LeoneSingaporeSlovak RepublicSloveniaSmall statesSolomon IslandsSomaliaSouth AfricaSouth AsiaSouth Asia (IDA & IBRD)SpainSri LankaSt. Kitts and NevisSt. LuciaSt. Vincent and the GrenadinesSub-Saharan Africa Sub-Saharan Africa (excluding high income)Sub-Saharan Africa (IDA & IBRD countries)SudanSurinameSwazilandSwedenSwitzerlandSyrian Arab RepublicTajikistanTanzaniaThailandTimor-LesteTogoTongaTrinidad and TobagoTunisiaTurkeyTurkmenistanTuvaluUgandaUkraineUnited KingdomUnited StatesUpper middle incomeUruguayUzbekistanVanuatuVenezuela, RBVietnamWest Bank and GazaWorldYemen, Rep.ZambiaZimbabwe Timeline:
This timeline shows a graph from 1961 to 2016 of Late-demographic dividend. No data until 1960. Number of actual observations by date: 56.
Source name:
World Development Indicators
Source organization:
World Bank national accounts data, and OECD National Accounts data files.
Categories, topics:
Economy & Growth
Last updated:
apr 23, 2017
Indicators value changes by year
Minimum:
30.411
jan 1, 1981
Maximum:
57.164
jan 1, 2016
At the date of observation
Value
Absolute change
Change from previous value
jan 1, 1961
35.634
+35.634
0.0%
jan 1, 1962
34.453
-1.181
-3.32%
jan 1, 1963
35.048
+0.595
1.73%
jan 1, 1964
32.539
-2.508
-7.16%
jan 1, 1965
32.931
+0.392
1.2%
jan 1, 1966
33.82
+0.888
2.7%
jan 1, 1967
32.533
-1.287
-3.81%
jan 1, 1968
33.879
+1.347
4.14%
jan 1, 1969
34.202
+0.323
0.95%
jan 1, 1970
33.976
-0.227
-0.66%
jan 1, 1971
32.67
-1.306
-3.84%
jan 1, 1972
32.552
-0.117
-0.36%
jan 1, 1973
32.602
+0.049
0.15%
jan 1, 1974
31.869
-0.732
-2.25%
jan 1, 1975
31.214
-0.656
-2.06%
jan 1, 1976
30.858
-0.356
-1.14%
jan 1, 1977
30.544
-0.313
-1.02%
jan 1, 1978
31.596
+1.052
3.44%
jan 1, 1979
32.294
+0.697
2.21%
jan 1, 1980
30.866
-1.428
-4.42%
jan 1, 1981
30.411
-0.455
-1.47%
jan 1, 1982
30.887
+0.475
1.56%
jan 1, 1983
31.01
+0.124
0.4%
jan 1, 1984
31.426
+0.416
1.34%
jan 1, 1985
32.463
+1.037
3.3%
jan 1, 1986
35.001
+2.538
7.82%
jan 1, 1987
35.407
+0.406
1.16%
jan 1, 1988
35.773
+0.366
1.03%
jan 1, 1989
36.622
+0.849
2.37%
jan 1, 1990
37.591
+0.969
2.65%
jan 1, 1991
38.277
+0.686
1.82%
jan 1, 1992
40.377
+2.1
5.49%
jan 1, 1993
42.09
+1.713
4.24%
jan 1, 1994
41.254
-0.837
-1.99%
jan 1, 1995
41.381
+0.127
0.31%
jan 1, 1996
46.082
+4.701
11.36%
jan 1, 1997
46.326
+0.244
0.53%
jan 1, 1998
47.394
+1.068
2.3%
jan 1, 1999
48.773
+1.379
2.91%
jan 1, 2000
49.464
+0.69
1.42%
jan 1, 2001
50.053
+0.589
1.19%
jan 1, 2002
51.076
+1.023
2.04%
jan 1, 2003
51.846
+0.77
1.51%
jan 1, 2004
51.377
-0.469
-0.9%
jan 1, 2005
50.264
-1.113
-2.17%
jan 1, 2006
50.422
+0.158
0.31%
jan 1, 2007
50.84
+0.418
0.83%
jan 1, 2008
51.705
+0.865
1.7%
jan 1, 2009
51.532
-0.173
-0.33%
jan 1, 2010
53.309
+1.777
3.45%
jan 1, 2011
52.533
-0.776
-1.46%
jan 1, 2012
52.356
-0.177
-0.34%
jan 1, 2013
53.458
+1.102
2.11%
jan 1, 2014
54.487
+1.029
1.92%
jan 1, 2015
55.662
+1.175
2.16%
jan 1, 2016
57.164
+1.502
2.7%
Ranking of countries by current statistics by years


Comments: