29
/
en
AIzaSyAYiBZKx7MnpbEhh9jyipgxe19OcubqV5w
April 1, 2024
252482
St. Vincent and the Grenadines
VCT
true
2
1
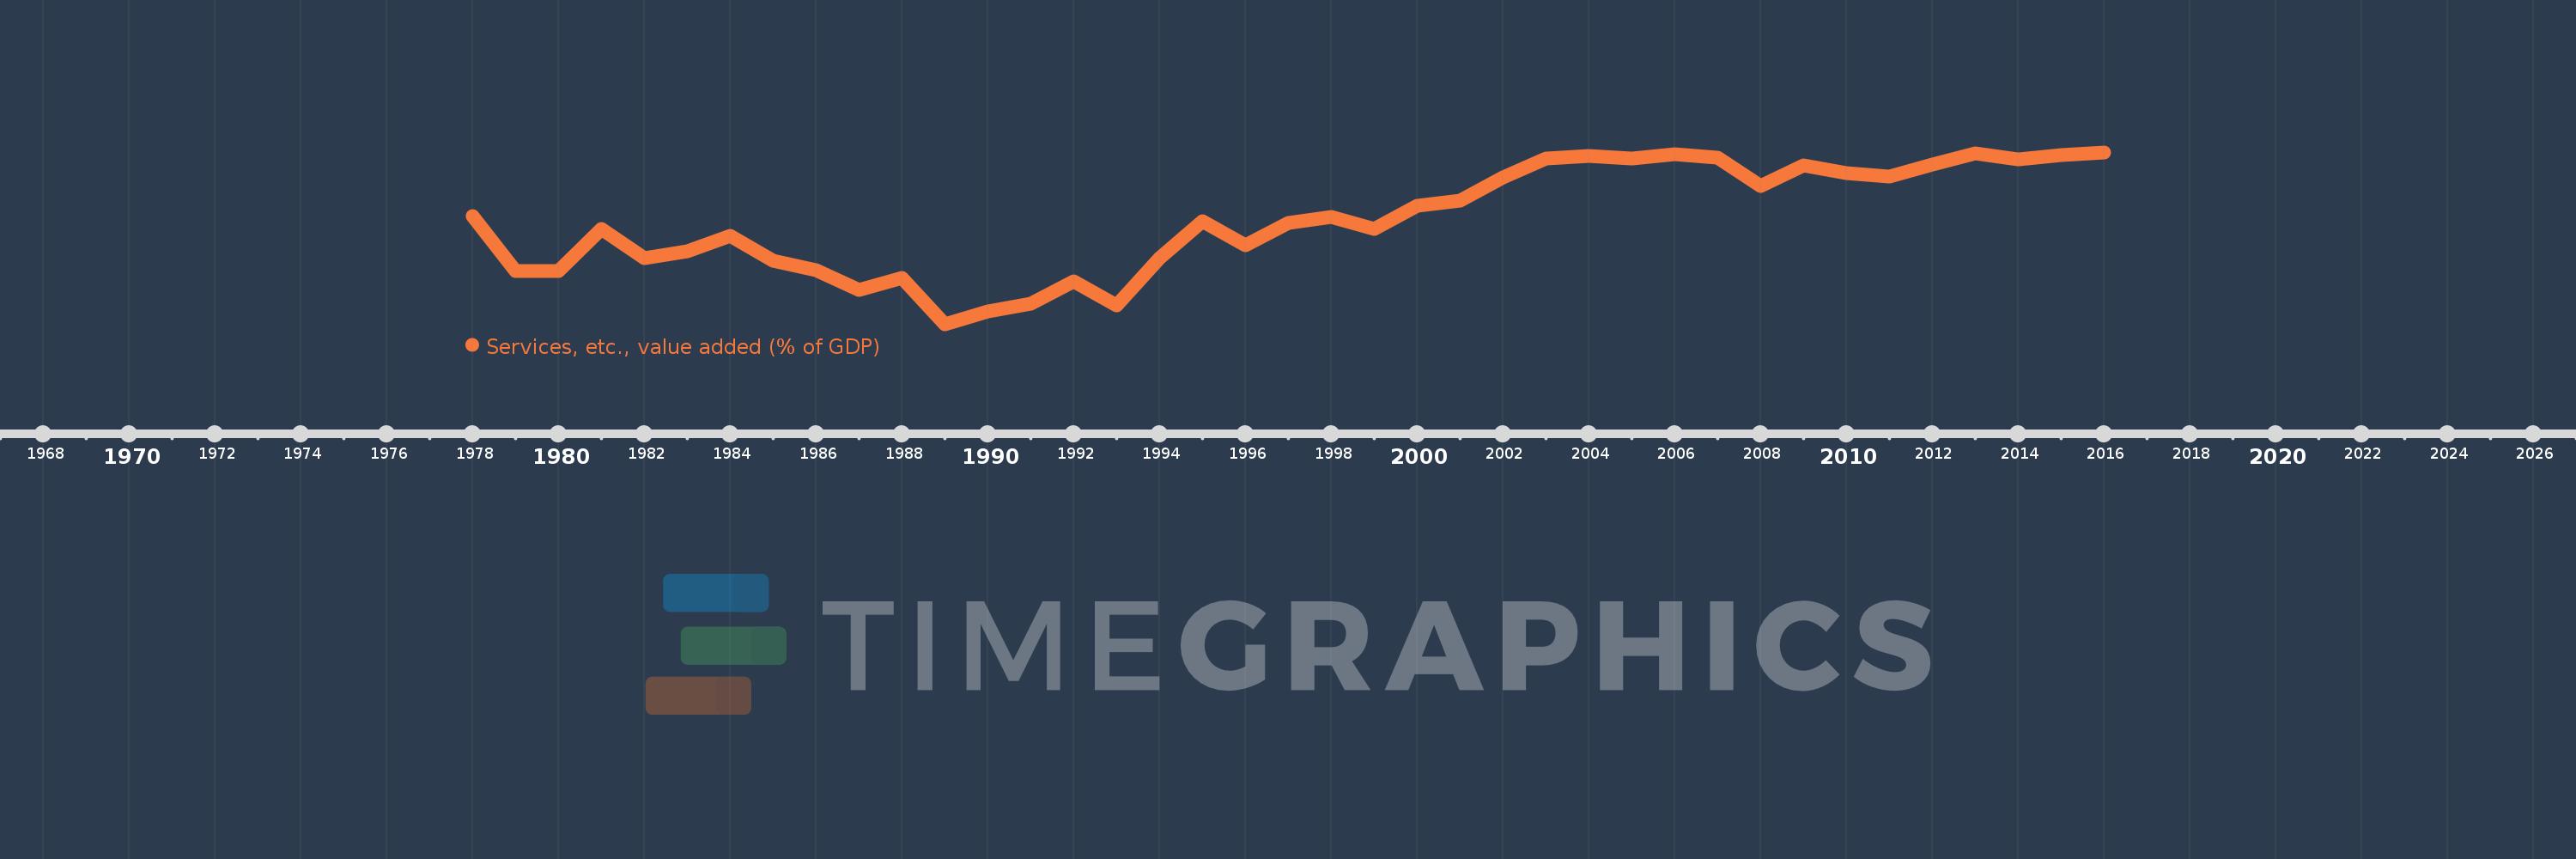
Services, etc., value added (% of GDP)
2016,2015,2014,2013,2012,2011,2010,2009,2008,2007,2006,2005,2004,2003,2002,2001,2000,1999,1998,1997,1996,1995,1994,1993,1992,1991,1990,1989,1988,1987,1986,1985,1984,1983,1982,1981,1980,1979,1978
This statistics in other country:
AfghanistanAlbaniaAlgeriaAndorraAngolaAntigua and BarbudaArab WorldArgentinaArmeniaArubaAustraliaAustriaAzerbaijanBahamas, TheBahrainBangladeshBarbadosBelarusBelgiumBelizeBeninBermudaBhutanBoliviaBosnia and HerzegovinaBotswanaBrazilBrunei DarussalamBulgariaBurkina FasoBurundiCabo VerdeCambodiaCameroonCanadaCaribbean small statesCentral African RepublicCentral Europe and the BalticsChadChileChinaColombiaComorosCongo, Dem. Rep.Congo, Rep.Costa RicaCote d'IvoireCroatiaCubaCyprusCzech RepublicDenmarkDjiboutiDominicaDominican RepublicEarly-demographic dividendEast Asia & PacificEast Asia & Pacific (excluding high income)East Asia & Pacific (IDA & IBRD countries)EcuadorEgypt, Arab Rep.El SalvadorEquatorial GuineaEritreaEstoniaEthiopiaEuro areaEurope & Central AsiaEurope & Central Asia (excluding high income)Europe & Central Asia (IDA & IBRD countries)European UnionFaroe IslandsFijiFinlandFragile and conflict affected situationsFranceGabonGambia, TheGeorgiaGermanyGhanaGreeceGrenadaGuatemalaGuineaGuinea-BissauGuyanaHeavily indebted poor countries (HIPC)High incomeHondurasHong Kong SAR, ChinaHungaryIBRD onlyIcelandIDA & IBRD totalIDA blendIDA onlyIDA totalIndiaIndonesiaIran, Islamic Rep.IrelandItalyJamaicaJapanJordanKazakhstanKenyaKiribatiKorea, Rep.KosovoKuwaitKyrgyz RepublicLao PDRLate-demographic dividendLatin America & Caribbean Latin America & Caribbean (excluding high income)Latin America & the Caribbean (IDA & IBRD countries)LatviaLeast developed countries: UN classificationLebanonLesothoLibyaLithuaniaLow & middle incomeLow incomeLower middle incomeLuxembourgMacao SAR, ChinaMacedonia, FYRMadagascarMalawiMalaysiaMaldivesMaliMaltaMarshall IslandsMauritaniaMauritiusMexicoMicronesia, Fed. Sts.Middle East & North AfricaMiddle East & North Africa (excluding high income)Middle East & North Africa (IDA & IBRD countries)Middle incomeMoldovaMongoliaMontenegroMoroccoMozambiqueMyanmarNamibiaNepalNetherlandsNew CaledoniaNew ZealandNicaraguaNigerNigeriaNorth AmericaNorwayOECD membersOmanOther small statesPacific island small statesPakistanPalauPanamaPapua New GuineaParaguayPeruPhilippinesPolandPortugalPost-demographic dividendPre-demographic dividendPuerto RicoQatarRomaniaRussian FederationRwandaSao Tome and PrincipeSaudi ArabiaSenegalSerbiaSeychellesSierra LeoneSingaporeSlovak RepublicSloveniaSmall statesSolomon IslandsSomaliaSouth AfricaSouth AsiaSouth Asia (IDA & IBRD)SpainSri LankaSt. Kitts and NevisSt. LuciaSt. Vincent and the GrenadinesSub-Saharan Africa Sub-Saharan Africa (excluding high income)Sub-Saharan Africa (IDA & IBRD countries)SudanSurinameSwazilandSwedenSwitzerlandSyrian Arab RepublicTajikistanTanzaniaThailandTimor-LesteTogoTongaTrinidad and TobagoTunisiaTurkeyTurkmenistanTuvaluUgandaUkraineUnited KingdomUnited StatesUpper middle incomeUruguayUzbekistanVanuatuVenezuela, RBVietnamWest Bank and GazaWorldYemen, Rep.ZambiaZimbabwe Timeline:
This timeline shows a graph from 1978 to 2016 of St. Vincent and the Grenadines. No data until 1977. Number of actual observations by date: 39.
Source name:
World Development Indicators
Source organization:
World Bank national accounts data, and OECD National Accounts data files.
Categories, topics:
Economy & Growth
Last updated:
apr 23, 2017
Indicators value changes by year
Minimum:
63.282
jan 1, 1989
Maximum:
75.007
jan 1, 2016
At the date of observation
Value
Absolute change
Change from previous value
jan 1, 1978
70.641
+70.641
0.0%
jan 1, 1979
66.894
-3.747
-5.3%
jan 1, 1980
66.939
+0.044
0.07%
jan 1, 1981
69.782
+2.843
4.25%
jan 1, 1982
67.797
-1.985
-2.84%
jan 1, 1983
68.233
+0.436
0.64%
jan 1, 1984
69.305
+1.072
1.57%
jan 1, 1985
67.588
-1.717
-2.48%
jan 1, 1986
66.945
-0.642
-0.95%
jan 1, 1987
65.643
-1.302
-1.94%
jan 1, 1988
66.471
+0.828
1.26%
jan 1, 1989
63.282
-3.189
-4.8%
jan 1, 1990
64.137
+0.856
1.35%
jan 1, 1991
64.655
+0.518
0.81%
jan 1, 1992
66.195
+1.54
2.38%
jan 1, 1993
64.583
-1.612
-2.43%
jan 1, 1994
67.786
+3.202
4.96%
jan 1, 1995
70.289
+2.504
3.69%
jan 1, 1996
68.682
-1.607
-2.29%
jan 1, 1997
70.212
+1.53
2.23%
jan 1, 1998
70.62
+0.408
0.58%
jan 1, 1999
69.771
-0.85
-1.2%
jan 1, 2000
71.349
+1.578
2.26%
jan 1, 2001
71.694
+0.345
0.48%
jan 1, 2002
73.302
+1.608
2.24%
jan 1, 2003
74.61
+1.308
1.78%
jan 1, 2004
74.78
+0.17
0.23%
jan 1, 2005
74.577
-0.203
-0.27%
jan 1, 2006
74.877
+0.3
0.4%
jan 1, 2007
74.657
-0.22
-0.29%
jan 1, 2008
72.742
-1.915
-2.57%
jan 1, 2009
74.11
+1.368
1.88%
jan 1, 2010
73.589
-0.52
-0.7%
jan 1, 2011
73.34
-0.249
-0.34%
jan 1, 2012
74.158
+0.818
1.12%
jan 1, 2013
74.955
+0.797
1.07%
jan 1, 2014
74.535
-0.42
-0.56%
jan 1, 2015
74.827
+0.292
0.39%
jan 1, 2016
75.007
+0.18
0.24%
Ranking of countries by current statistics by years


Comments: