29
/
en
AIzaSyAYiBZKx7MnpbEhh9jyipgxe19OcubqV5w
April 1, 2024
156722
Indonesia
IDN
true
2
1
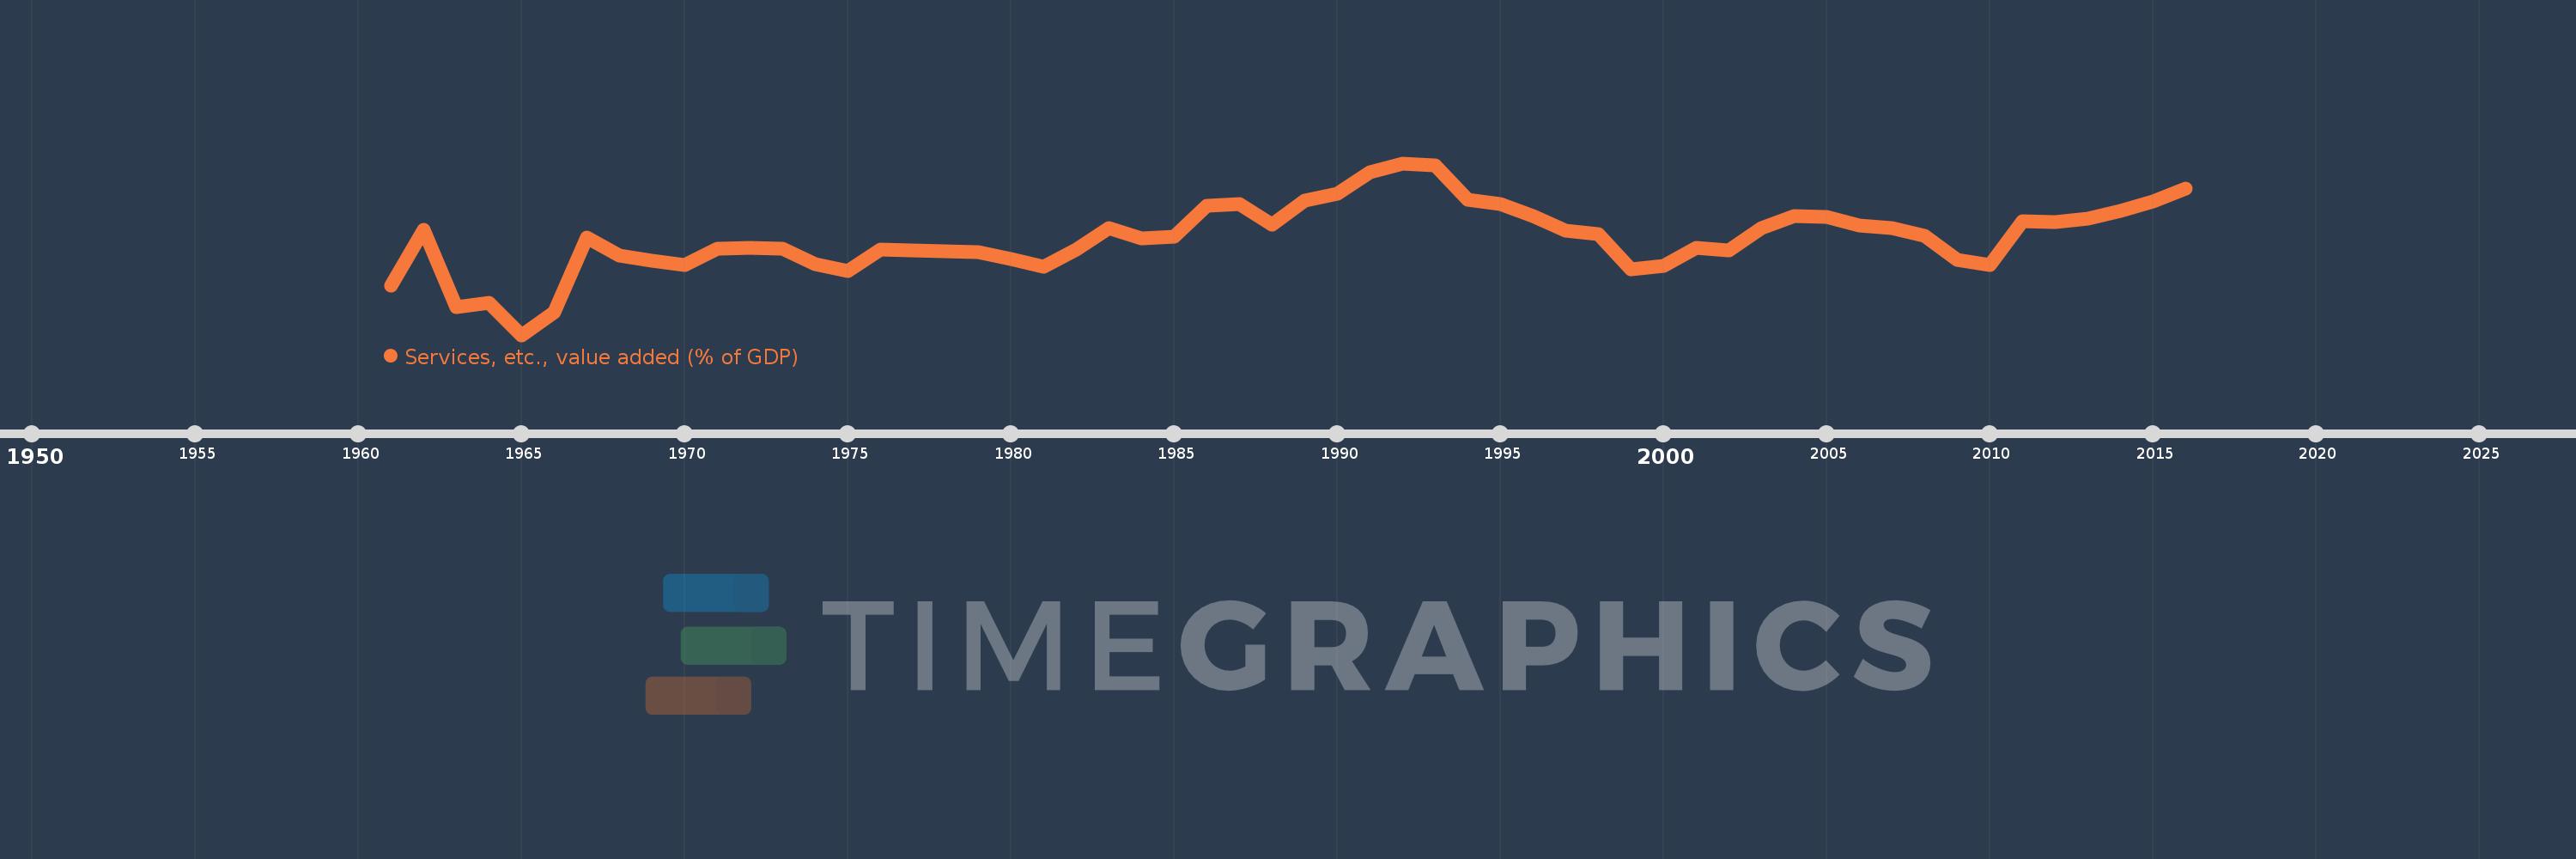
Services, etc., value added (% of GDP)
2016,2015,2014,2013,2012,2011,2010,2009,2008,2007,2006,2005,2004,2003,2002,2001,2000,1999,1998,1997,1996,1995,1994,1993,1992,1991,1990,1989,1988,1987,1986,1985,1984,1983,1982,1981,1980,1979,1978,1977,1976,1975,1974,1973,1972,1971,1970,1969,1968,1967,1966,1965,1964,1963,1962,1961
This statistics in other country:
AfghanistanAlbaniaAlgeriaAndorraAngolaAntigua and BarbudaArab WorldArgentinaArmeniaArubaAustraliaAustriaAzerbaijanBahamas, TheBahrainBangladeshBarbadosBelarusBelgiumBelizeBeninBermudaBhutanBoliviaBosnia and HerzegovinaBotswanaBrazilBrunei DarussalamBulgariaBurkina FasoBurundiCabo VerdeCambodiaCameroonCanadaCaribbean small statesCentral African RepublicCentral Europe and the BalticsChadChileChinaColombiaComorosCongo, Dem. Rep.Congo, Rep.Costa RicaCote d'IvoireCroatiaCubaCyprusCzech RepublicDenmarkDjiboutiDominicaDominican RepublicEarly-demographic dividendEast Asia & PacificEast Asia & Pacific (excluding high income)East Asia & Pacific (IDA & IBRD countries)EcuadorEgypt, Arab Rep.El SalvadorEquatorial GuineaEritreaEstoniaEthiopiaEuro areaEurope & Central AsiaEurope & Central Asia (excluding high income)Europe & Central Asia (IDA & IBRD countries)European UnionFaroe IslandsFijiFinlandFragile and conflict affected situationsFranceGabonGambia, TheGeorgiaGermanyGhanaGreeceGrenadaGuatemalaGuineaGuinea-BissauGuyanaHeavily indebted poor countries (HIPC)High incomeHondurasHong Kong SAR, ChinaHungaryIBRD onlyIcelandIDA & IBRD totalIDA blendIDA onlyIDA totalIndiaIndonesiaIran, Islamic Rep.IrelandItalyJamaicaJapanJordanKazakhstanKenyaKiribatiKorea, Rep.KosovoKuwaitKyrgyz RepublicLao PDRLate-demographic dividendLatin America & Caribbean Latin America & Caribbean (excluding high income)Latin America & the Caribbean (IDA & IBRD countries)LatviaLeast developed countries: UN classificationLebanonLesothoLibyaLithuaniaLow & middle incomeLow incomeLower middle incomeLuxembourgMacao SAR, ChinaMacedonia, FYRMadagascarMalawiMalaysiaMaldivesMaliMaltaMarshall IslandsMauritaniaMauritiusMexicoMicronesia, Fed. Sts.Middle East & North AfricaMiddle East & North Africa (excluding high income)Middle East & North Africa (IDA & IBRD countries)Middle incomeMoldovaMongoliaMontenegroMoroccoMozambiqueMyanmarNamibiaNepalNetherlandsNew CaledoniaNew ZealandNicaraguaNigerNigeriaNorth AmericaNorwayOECD membersOmanOther small statesPacific island small statesPakistanPalauPanamaPapua New GuineaParaguayPeruPhilippinesPolandPortugalPost-demographic dividendPre-demographic dividendPuerto RicoQatarRomaniaRussian FederationRwandaSao Tome and PrincipeSaudi ArabiaSenegalSerbiaSeychellesSierra LeoneSingaporeSlovak RepublicSloveniaSmall statesSolomon IslandsSomaliaSouth AfricaSouth AsiaSouth Asia (IDA & IBRD)SpainSri LankaSt. Kitts and NevisSt. LuciaSt. Vincent and the GrenadinesSub-Saharan Africa Sub-Saharan Africa (excluding high income)Sub-Saharan Africa (IDA & IBRD countries)SudanSurinameSwazilandSwedenSwitzerlandSyrian Arab RepublicTajikistanTanzaniaThailandTimor-LesteTogoTongaTrinidad and TobagoTunisiaTurkeyTurkmenistanTuvaluUgandaUkraineUnited KingdomUnited StatesUpper middle incomeUruguayUzbekistanVanuatuVenezuela, RBVietnamWest Bank and GazaWorldYemen, Rep.ZambiaZimbabwe Timeline:
This timeline shows a graph from 1961 to 2016 of Indonesia. No data until 1960. Number of actual observations by date: 56.
Source name:
World Development Indicators
Source organization:
World Bank national accounts data, and OECD National Accounts data files.
Categories, topics:
Economy & Growth
Last updated:
apr 23, 2017
Indicators value changes by year
Minimum:
31.317
jan 1, 1965
Maximum:
45.434
jan 1, 1992
At the date of observation
Value
Absolute change
Change from previous value
jan 1, 1961
35.366
+35.366
0.0%
jan 1, 1962
39.991
+4.625
13.08%
jan 1, 1963
33.63
-6.361
-15.91%
jan 1, 1964
33.938
+0.307
0.91%
jan 1, 1965
31.317
-2.621
-7.72%
jan 1, 1966
33.155
+1.838
5.87%
jan 1, 1967
39.31
+6.155
18.56%
jan 1, 1968
37.837
-1.472
-3.75%
jan 1, 1969
37.441
-0.396
-1.05%
jan 1, 1970
37.052
-0.389
-1.04%
jan 1, 1971
38.382
+1.33
3.59%
jan 1, 1972
38.5
+0.117
0.31%
jan 1, 1973
38.413
-0.087
-0.23%
jan 1, 1974
37.158
-1.255
-3.27%
jan 1, 1975
36.608
-0.55
-1.48%
jan 1, 1976
38.359
+1.751
4.78%
jan 1, 1977
38.284
-0.075
-0.2%
jan 1, 1978
38.213
-0.071
-0.19%
jan 1, 1979
38.161
-0.052
-0.14%
jan 1, 1980
37.555
-0.606
-1.59%
jan 1, 1981
36.93
-0.624
-1.66%
jan 1, 1982
38.307
+1.377
3.73%
jan 1, 1983
40.081
+1.774
4.63%
jan 1, 1984
39.273
-0.808
-2.01%
jan 1, 1985
39.405
+0.132
0.34%
jan 1, 1986
41.928
+2.523
6.4%
jan 1, 1987
42.093
+0.165
0.39%
jan 1, 1988
40.416
-1.677
-3.98%
jan 1, 1989
42.393
+1.978
4.89%
jan 1, 1990
42.963
+0.569
1.34%
jan 1, 1991
44.709
+1.746
4.06%
jan 1, 1992
45.434
+0.726
1.62%
jan 1, 1993
45.288
-0.147
-0.32%
jan 1, 1994
42.44
-2.848
-6.29%
jan 1, 1995
42.072
-0.368
-0.87%
jan 1, 1996
41.061
-1.011
-2.4%
jan 1, 1997
39.872
-1.189
-2.9%
jan 1, 1998
39.579
-0.293
-0.74%
jan 1, 1999
36.689
-2.89
-7.3%
jan 1, 2000
37.027
+0.338
0.92%
jan 1, 2001
38.473
+1.445
3.9%
jan 1, 2002
38.255
-0.218
-0.57%
jan 1, 2003
40.081
+1.826
4.77%
jan 1, 2004
41.065
+0.984
2.46%
jan 1, 2005
41.037
-0.028
-0.07%
jan 1, 2006
40.332
-0.704
-1.72%
jan 1, 2007
40.083
-0.25
-0.62%
jan 1, 2008
39.484
-0.598
-1.49%
jan 1, 2009
37.458
-2.027
-5.13%
jan 1, 2010
37.058
-0.4
-1.07%
jan 1, 2011
40.666
+3.608
9.74%
jan 1, 2012
40.585
-0.081
-0.2%
jan 1, 2013
40.873
+0.289
0.71%
jan 1, 2014
41.517
+0.643
1.57%
jan 1, 2015
42.267
+0.751
1.81%
jan 1, 2016
43.324
+1.056
2.5%
Ranking of countries by current statistics by years


Comments: