29
/
en
AIzaSyAYiBZKx7MnpbEhh9jyipgxe19OcubqV5w
April 1, 2024
110356
Congo, Dem. Rep.
COD
true
2
1
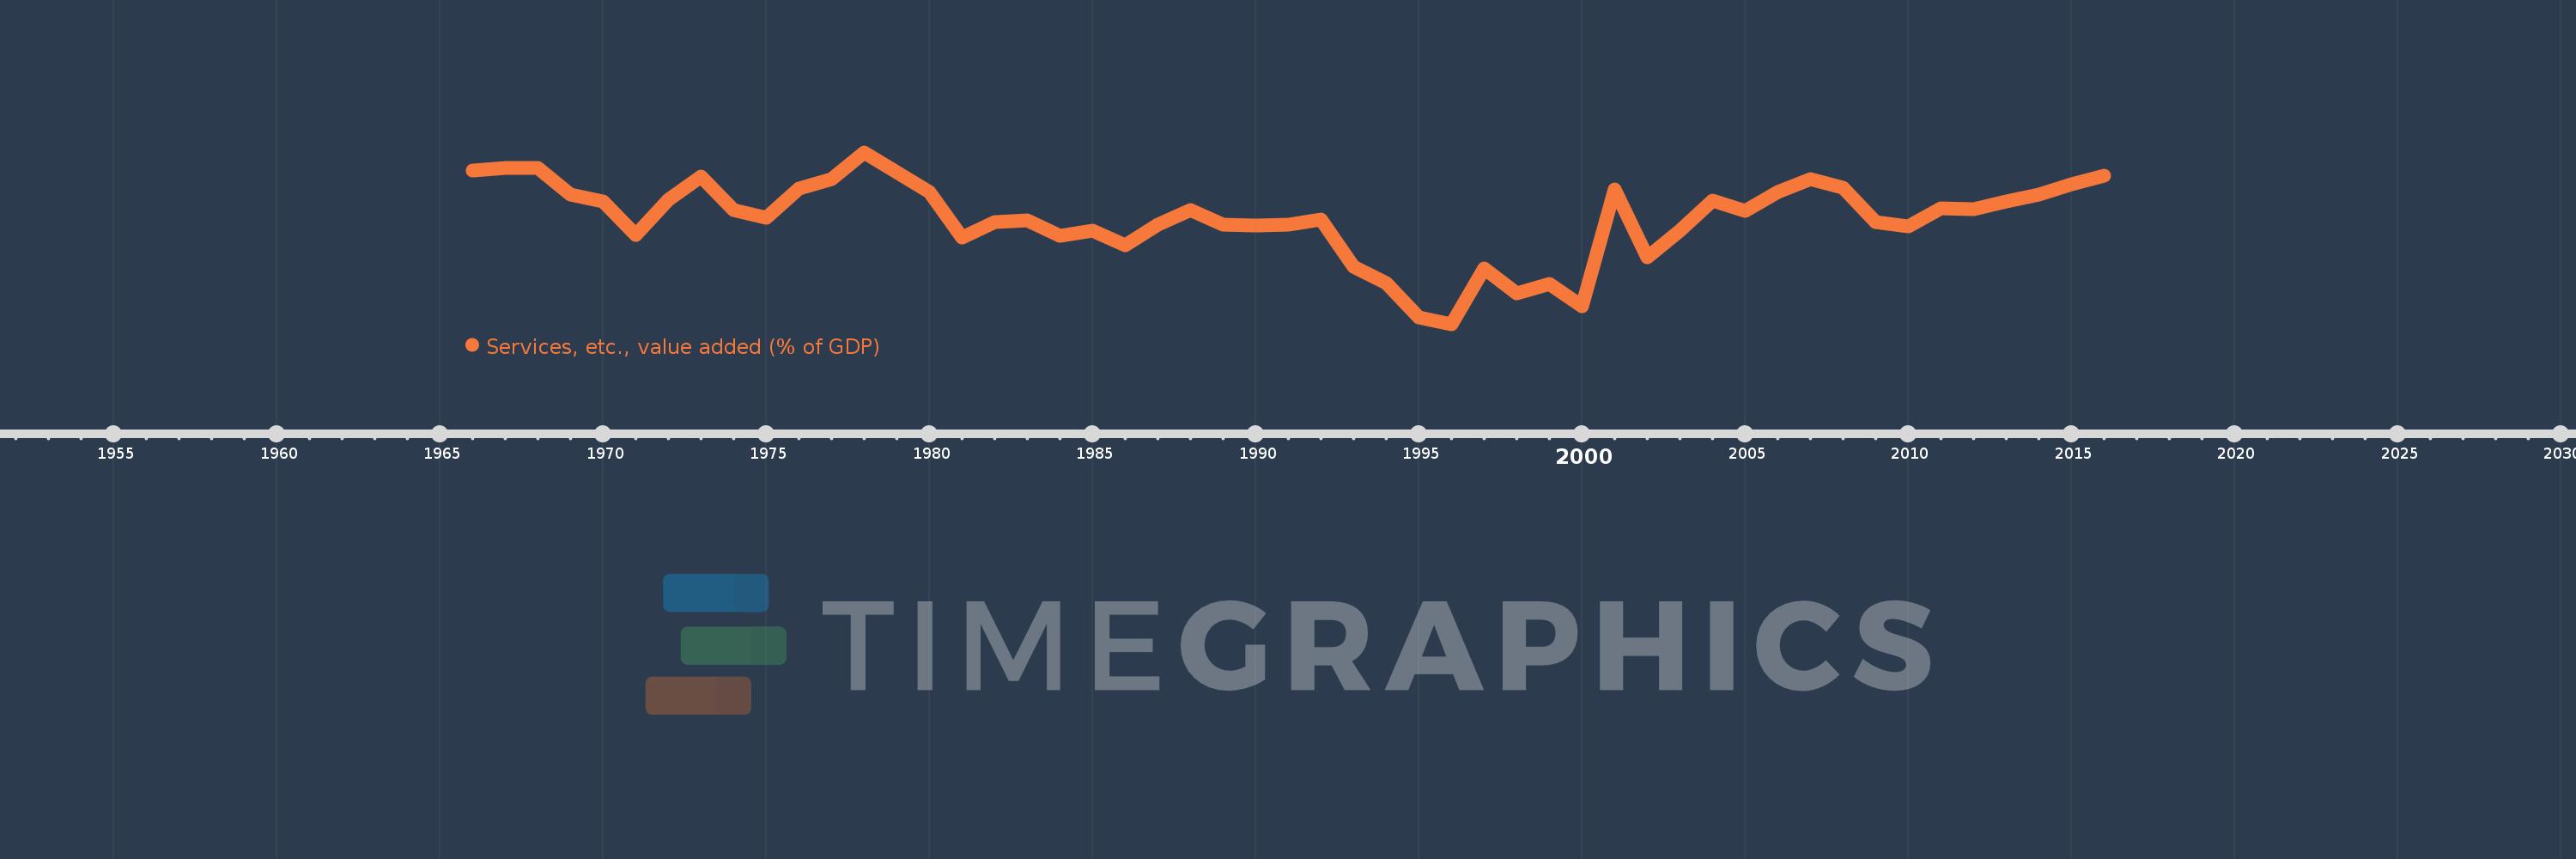
Services, etc., value added (% of GDP)
2016,2015,2014,2013,2012,2011,2010,2009,2008,2007,2006,2005,2004,2003,2002,2001,2000,1999,1998,1997,1996,1995,1994,1993,1992,1991,1990,1989,1988,1987,1986,1985,1984,1983,1982,1981,1980,1979,1978,1977,1976,1975,1974,1973,1972,1971,1970,1969,1968,1967,1966
This statistics in other country:
AfghanistanAlbaniaAlgeriaAndorraAngolaAntigua and BarbudaArab WorldArgentinaArmeniaArubaAustraliaAustriaAzerbaijanBahamas, TheBahrainBangladeshBarbadosBelarusBelgiumBelizeBeninBermudaBhutanBoliviaBosnia and HerzegovinaBotswanaBrazilBrunei DarussalamBulgariaBurkina FasoBurundiCabo VerdeCambodiaCameroonCanadaCaribbean small statesCentral African RepublicCentral Europe and the BalticsChadChileChinaColombiaComorosCongo, Dem. Rep.Congo, Rep.Costa RicaCote d'IvoireCroatiaCubaCyprusCzech RepublicDenmarkDjiboutiDominicaDominican RepublicEarly-demographic dividendEast Asia & PacificEast Asia & Pacific (excluding high income)East Asia & Pacific (IDA & IBRD countries)EcuadorEgypt, Arab Rep.El SalvadorEquatorial GuineaEritreaEstoniaEthiopiaEuro areaEurope & Central AsiaEurope & Central Asia (excluding high income)Europe & Central Asia (IDA & IBRD countries)European UnionFaroe IslandsFijiFinlandFragile and conflict affected situationsFranceGabonGambia, TheGeorgiaGermanyGhanaGreeceGrenadaGuatemalaGuineaGuinea-BissauGuyanaHeavily indebted poor countries (HIPC)High incomeHondurasHong Kong SAR, ChinaHungaryIBRD onlyIcelandIDA & IBRD totalIDA blendIDA onlyIDA totalIndiaIndonesiaIran, Islamic Rep.IrelandItalyJamaicaJapanJordanKazakhstanKenyaKiribatiKorea, Rep.KosovoKuwaitKyrgyz RepublicLao PDRLate-demographic dividendLatin America & Caribbean Latin America & Caribbean (excluding high income)Latin America & the Caribbean (IDA & IBRD countries)LatviaLeast developed countries: UN classificationLebanonLesothoLibyaLithuaniaLow & middle incomeLow incomeLower middle incomeLuxembourgMacao SAR, ChinaMacedonia, FYRMadagascarMalawiMalaysiaMaldivesMaliMaltaMarshall IslandsMauritaniaMauritiusMexicoMicronesia, Fed. Sts.Middle East & North AfricaMiddle East & North Africa (excluding high income)Middle East & North Africa (IDA & IBRD countries)Middle incomeMoldovaMongoliaMontenegroMoroccoMozambiqueMyanmarNamibiaNepalNetherlandsNew CaledoniaNew ZealandNicaraguaNigerNigeriaNorth AmericaNorwayOECD membersOmanOther small statesPacific island small statesPakistanPalauPanamaPapua New GuineaParaguayPeruPhilippinesPolandPortugalPost-demographic dividendPre-demographic dividendPuerto RicoQatarRomaniaRussian FederationRwandaSao Tome and PrincipeSaudi ArabiaSenegalSerbiaSeychellesSierra LeoneSingaporeSlovak RepublicSloveniaSmall statesSolomon IslandsSomaliaSouth AfricaSouth AsiaSouth Asia (IDA & IBRD)SpainSri LankaSt. Kitts and NevisSt. LuciaSt. Vincent and the GrenadinesSub-Saharan Africa Sub-Saharan Africa (excluding high income)Sub-Saharan Africa (IDA & IBRD countries)SudanSurinameSwazilandSwedenSwitzerlandSyrian Arab RepublicTajikistanTanzaniaThailandTimor-LesteTogoTongaTrinidad and TobagoTunisiaTurkeyTurkmenistanTuvaluUgandaUkraineUnited KingdomUnited StatesUpper middle incomeUruguayUzbekistanVanuatuVenezuela, RBVietnamWest Bank and GazaWorldYemen, Rep.ZambiaZimbabwe Timeline:
This timeline shows a graph from 1966 to 2016 of Congo, Dem. Rep.. No data until 1965. Number of actual observations by date: 51.
Source name:
World Development Indicators
Source organization:
World Bank national accounts data, and OECD National Accounts data files.
Categories, topics:
Economy & Growth
Last updated:
apr 23, 2017
Indicators value changes by year
Maximum:
50.163
jan 1, 1978
At the date of observation
Value
Absolute change
Change from previous value
jan 1, 1966
47.649
+47.649
0.0%
jan 1, 1967
47.962
+0.312
0.66%
jan 1, 1968
48.007
+0.045
0.09%
jan 1, 1969
44.178
-3.83
-7.98%
jan 1, 1970
43.265
-0.912
-2.07%
jan 1, 1971
38.58
-4.685
-10.83%
jan 1, 1972
43.454
+4.875
12.64%
jan 1, 1973
46.781
+3.327
7.66%
jan 1, 1974
42.05
-4.731
-10.11%
jan 1, 1975
41.008
-1.042
-2.48%
jan 1, 1976
45.042
+4.034
9.84%
jan 1, 1977
46.448
+1.407
3.12%
jan 1, 1978
50.163
+3.714
8.0%
jan 1, 1979
47.391
-2.771
-5.52%
jan 1, 1980
44.546
-2.845
-6.0%
jan 1, 1981
38.18
-6.366
-14.29%
jan 1, 1982
40.347
+2.167
5.68%
jan 1, 1983
40.664
+0.317
0.79%
jan 1, 1984
38.461
-2.203
-5.42%
jan 1, 1985
39.141
+0.679
1.77%
jan 1, 1986
37.132
-2.009
-5.13%
jan 1, 1987
39.964
+2.832
7.63%
jan 1, 1988
42.002
+2.038
5.1%
jan 1, 1989
39.978
-2.024
-4.82%
jan 1, 1990
39.842
-0.136
-0.34%
jan 1, 1991
40.045
+0.203
0.51%
jan 1, 1992
40.76
+0.715
1.79%
jan 1, 1993
34.102
-6.658
-16.34%
jan 1, 1994
31.769
-2.332
-6.84%
jan 1, 1995
27.0
-4.769
-15.01%
jan 1, 1996
26.0
-1.0
-3.7%
jan 1, 1997
33.813
+7.813
30.05%
jan 1, 1998
30.328
-3.485
-10.31%
jan 1, 1999
31.641
+1.313
4.33%
jan 1, 2000
28.472
-3.168
-10.01%
jan 1, 2001
45.012
+16.54
58.09%
jan 1, 2002
35.455
-9.557
-21.23%
jan 1, 2003
39.126
+3.671
10.35%
jan 1, 2004
43.332
+4.206
10.75%
jan 1, 2005
41.92
-1.412
-3.26%
jan 1, 2006
44.645
+2.725
6.5%
jan 1, 2007
46.346
+1.701
3.81%
jan 1, 2008
45.21
-1.136
-2.45%
jan 1, 2009
40.33
-4.88
-10.79%
jan 1, 2010
39.741
-0.589
-1.46%
jan 1, 2011
42.282
+2.541
6.39%
jan 1, 2012
42.197
-0.085
-0.2%
jan 1, 2013
43.235
+1.039
2.46%
jan 1, 2014
44.277
+1.042
2.41%
jan 1, 2015
45.659
+1.381
3.12%
jan 1, 2016
46.91
+1.251
2.74%
Ranking of countries by current statistics by years


Comments: