29
/
en
AIzaSyAYiBZKx7MnpbEhh9jyipgxe19OcubqV5w
April 1, 2024
262984
Thailand
THA
true
2
1
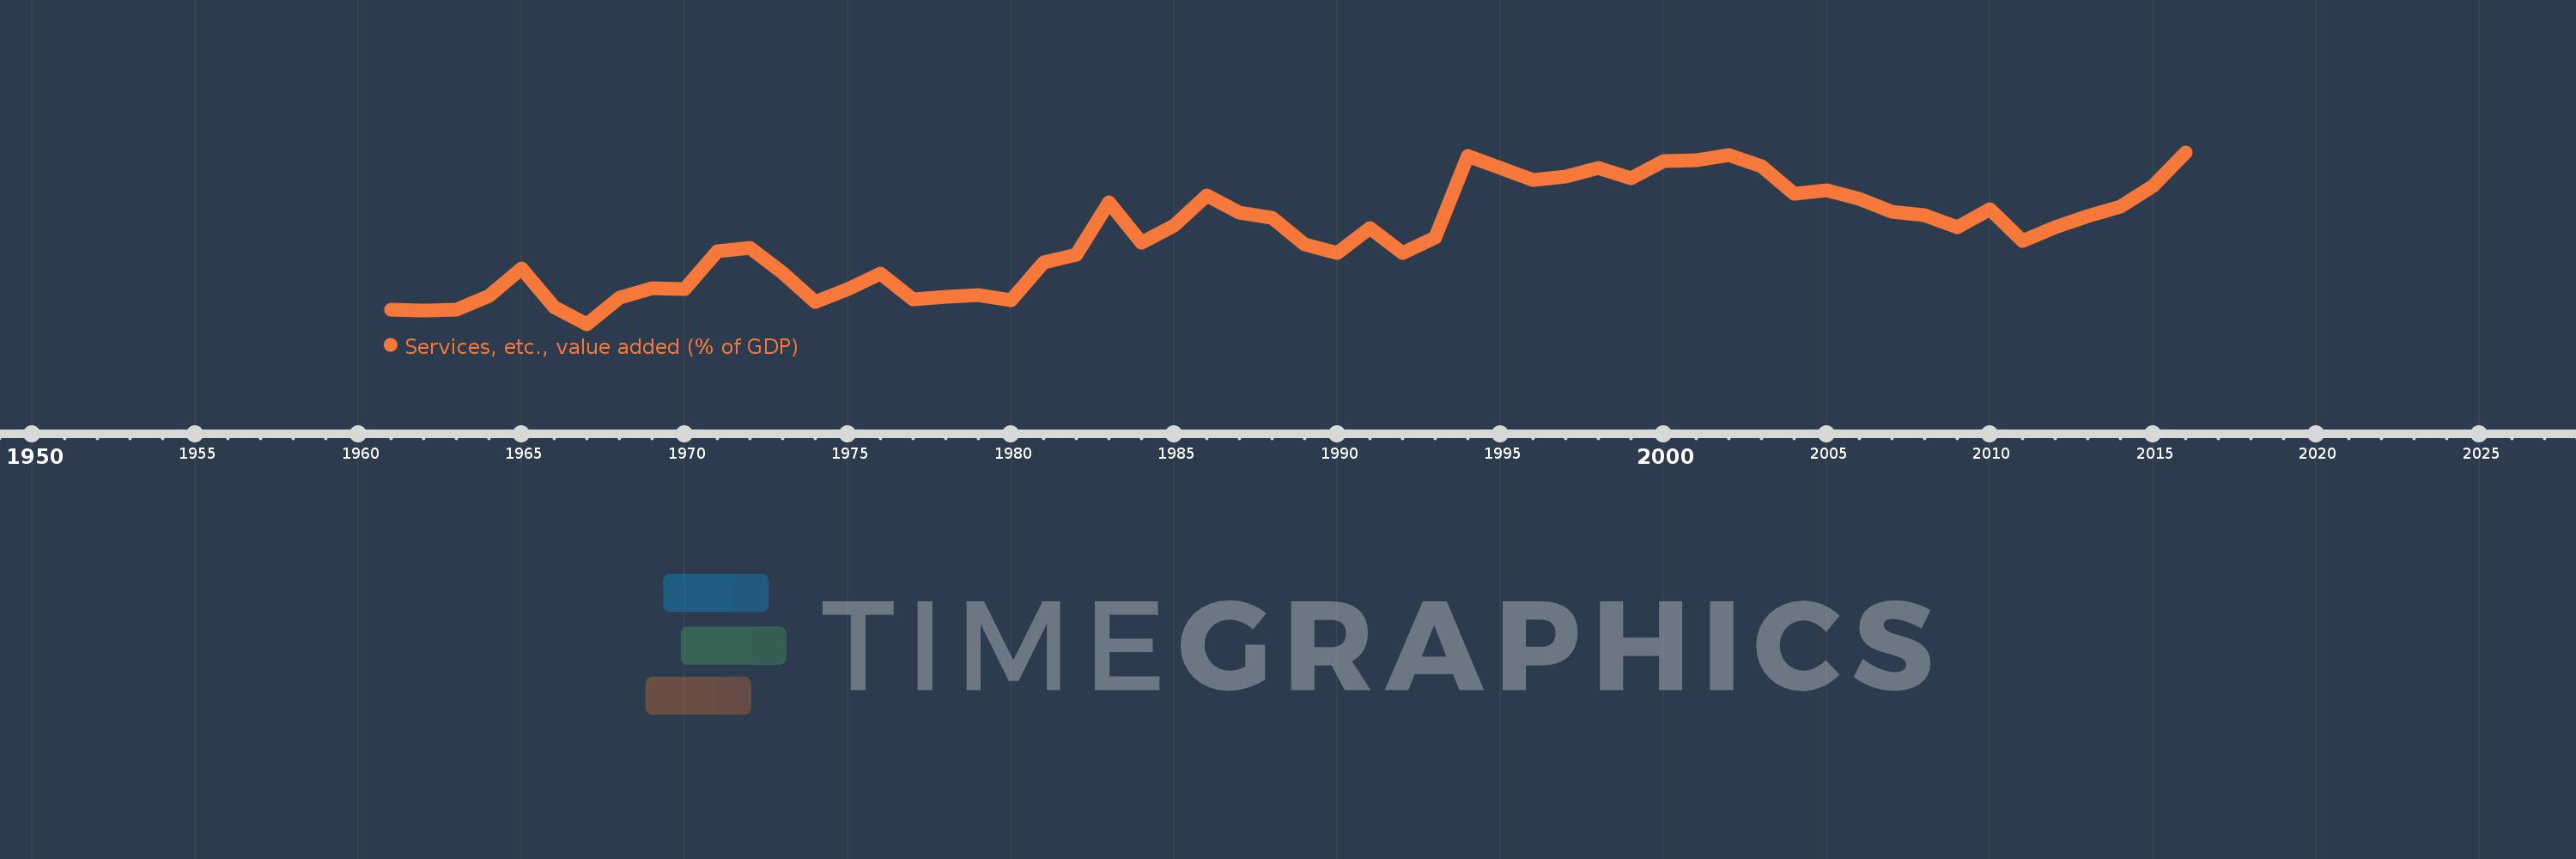
Services, etc., value added (% of GDP)
2016,2015,2014,2013,2012,2011,2010,2009,2008,2007,2006,2005,2004,2003,2002,2001,2000,1999,1998,1997,1996,1995,1994,1993,1992,1991,1990,1989,1988,1987,1986,1985,1984,1983,1982,1981,1980,1979,1978,1977,1976,1975,1974,1973,1972,1971,1970,1969,1968,1967,1966,1965,1964,1963,1962,1961
This statistics in other country:
AfghanistanAlbaniaAlgeriaAndorraAngolaAntigua and BarbudaArab WorldArgentinaArmeniaArubaAustraliaAustriaAzerbaijanBahamas, TheBahrainBangladeshBarbadosBelarusBelgiumBelizeBeninBermudaBhutanBoliviaBosnia and HerzegovinaBotswanaBrazilBrunei DarussalamBulgariaBurkina FasoBurundiCabo VerdeCambodiaCameroonCanadaCaribbean small statesCentral African RepublicCentral Europe and the BalticsChadChileChinaColombiaComorosCongo, Dem. Rep.Congo, Rep.Costa RicaCote d'IvoireCroatiaCubaCyprusCzech RepublicDenmarkDjiboutiDominicaDominican RepublicEarly-demographic dividendEast Asia & PacificEast Asia & Pacific (excluding high income)East Asia & Pacific (IDA & IBRD countries)EcuadorEgypt, Arab Rep.El SalvadorEquatorial GuineaEritreaEstoniaEthiopiaEuro areaEurope & Central AsiaEurope & Central Asia (excluding high income)Europe & Central Asia (IDA & IBRD countries)European UnionFaroe IslandsFijiFinlandFragile and conflict affected situationsFranceGabonGambia, TheGeorgiaGermanyGhanaGreeceGrenadaGuatemalaGuineaGuinea-BissauGuyanaHeavily indebted poor countries (HIPC)High incomeHondurasHong Kong SAR, ChinaHungaryIBRD onlyIcelandIDA & IBRD totalIDA blendIDA onlyIDA totalIndiaIndonesiaIran, Islamic Rep.IrelandItalyJamaicaJapanJordanKazakhstanKenyaKiribatiKorea, Rep.KosovoKuwaitKyrgyz RepublicLao PDRLate-demographic dividendLatin America & Caribbean Latin America & Caribbean (excluding high income)Latin America & the Caribbean (IDA & IBRD countries)LatviaLeast developed countries: UN classificationLebanonLesothoLibyaLithuaniaLow & middle incomeLow incomeLower middle incomeLuxembourgMacao SAR, ChinaMacedonia, FYRMadagascarMalawiMalaysiaMaldivesMaliMaltaMarshall IslandsMauritaniaMauritiusMexicoMicronesia, Fed. Sts.Middle East & North AfricaMiddle East & North Africa (excluding high income)Middle East & North Africa (IDA & IBRD countries)Middle incomeMoldovaMongoliaMontenegroMoroccoMozambiqueMyanmarNamibiaNepalNetherlandsNew CaledoniaNew ZealandNicaraguaNigerNigeriaNorth AmericaNorwayOECD membersOmanOther small statesPacific island small statesPakistanPalauPanamaPapua New GuineaParaguayPeruPhilippinesPolandPortugalPost-demographic dividendPre-demographic dividendPuerto RicoQatarRomaniaRussian FederationRwandaSao Tome and PrincipeSaudi ArabiaSenegalSerbiaSeychellesSierra LeoneSingaporeSlovak RepublicSloveniaSmall statesSolomon IslandsSomaliaSouth AfricaSouth AsiaSouth Asia (IDA & IBRD)SpainSri LankaSt. Kitts and NevisSt. LuciaSt. Vincent and the GrenadinesSub-Saharan Africa Sub-Saharan Africa (excluding high income)Sub-Saharan Africa (IDA & IBRD countries)SudanSurinameSwazilandSwedenSwitzerlandSyrian Arab RepublicTajikistanTanzaniaThailandTimor-LesteTogoTongaTrinidad and TobagoTunisiaTurkeyTurkmenistanTuvaluUgandaUkraineUnited KingdomUnited StatesUpper middle incomeUruguayUzbekistanVanuatuVenezuela, RBVietnamWest Bank and GazaWorldYemen, Rep.ZambiaZimbabwe Timeline:
This timeline shows a graph from 1961 to 2016 of Thailand. No data until 1960. Number of actual observations by date: 56.
Source name:
World Development Indicators
Source organization:
World Bank national accounts data, and OECD National Accounts data files.
Categories, topics:
Economy & Growth
Last updated:
apr 23, 2017
Indicators value changes by year
Minimum:
44.094
jan 1, 1967
At the date of observation
Value
Absolute change
Change from previous value
jan 1, 1961
45.039
+45.039
0.0%
jan 1, 1962
44.997
-0.042
-0.09%
jan 1, 1963
45.054
+0.057
0.13%
jan 1, 1964
45.907
+0.853
1.89%
jan 1, 1965
47.666
+1.758
3.83%
jan 1, 1966
45.191
-2.474
-5.19%
jan 1, 1967
44.094
-1.097
-2.43%
jan 1, 1968
45.799
+1.705
3.87%
jan 1, 1969
46.411
+0.613
1.34%
jan 1, 1970
46.379
-0.033
-0.07%
jan 1, 1971
48.779
+2.4
5.18%
jan 1, 1972
49.022
+0.243
0.5%
jan 1, 1973
47.384
-1.638
-3.34%
jan 1, 1974
45.52
-1.864
-3.93%
jan 1, 1975
46.347
+0.827
1.82%
jan 1, 1976
47.346
+0.999
2.16%
jan 1, 1977
45.685
-1.66
-3.51%
jan 1, 1978
45.874
+0.188
0.41%
jan 1, 1979
45.944
+0.071
0.15%
jan 1, 1980
45.661
-0.283
-0.62%
jan 1, 1981
48.082
+2.421
5.3%
jan 1, 1982
48.544
+0.462
0.96%
jan 1, 1983
51.942
+3.398
7.0%
jan 1, 1984
49.357
-2.585
-4.98%
jan 1, 1985
50.451
+1.094
2.22%
jan 1, 1986
52.348
+1.897
3.76%
jan 1, 1987
51.253
-1.095
-2.09%
jan 1, 1988
50.923
-0.33
-0.64%
jan 1, 1989
49.242
-1.681
-3.3%
jan 1, 1990
48.673
-0.569
-1.16%
jan 1, 1991
50.276
+1.602
3.29%
jan 1, 1992
48.692
-1.583
-3.15%
jan 1, 1993
49.647
+0.955
1.96%
jan 1, 1994
54.893
+5.246
10.57%
jan 1, 1995
54.148
-0.745
-1.36%
jan 1, 1996
53.391
-0.757
-1.4%
jan 1, 1997
53.613
+0.222
0.42%
jan 1, 1998
54.15
+0.536
1.0%
jan 1, 1999
53.453
-0.697
-1.29%
jan 1, 2000
54.556
+1.104
2.06%
jan 1, 2001
54.658
+0.101
0.19%
jan 1, 2002
54.95
+0.293
0.54%
jan 1, 2003
54.259
-0.691
-1.26%
jan 1, 2004
52.497
-1.762
-3.25%
jan 1, 2005
52.678
+0.18
0.34%
jan 1, 2006
52.173
-0.505
-0.96%
jan 1, 2007
51.324
-0.849
-1.63%
jan 1, 2008
51.103
-0.221
-0.43%
jan 1, 2009
50.339
-0.764
-1.5%
jan 1, 2010
51.479
+1.14
2.26%
jan 1, 2011
49.435
-2.044
-3.97%
jan 1, 2012
50.305
+0.869
1.76%
jan 1, 2013
51.032
+0.727
1.45%
jan 1, 2014
51.628
+0.596
1.17%
jan 1, 2015
52.996
+1.368
2.65%
jan 1, 2016
55.14
+2.144
4.05%
Ranking of countries by current statistics by years


Comments: