29
/
en
AIzaSyAYiBZKx7MnpbEhh9jyipgxe19OcubqV5w
April 1, 2024
41918
Latin America & Caribbean
LCN
false
2
1
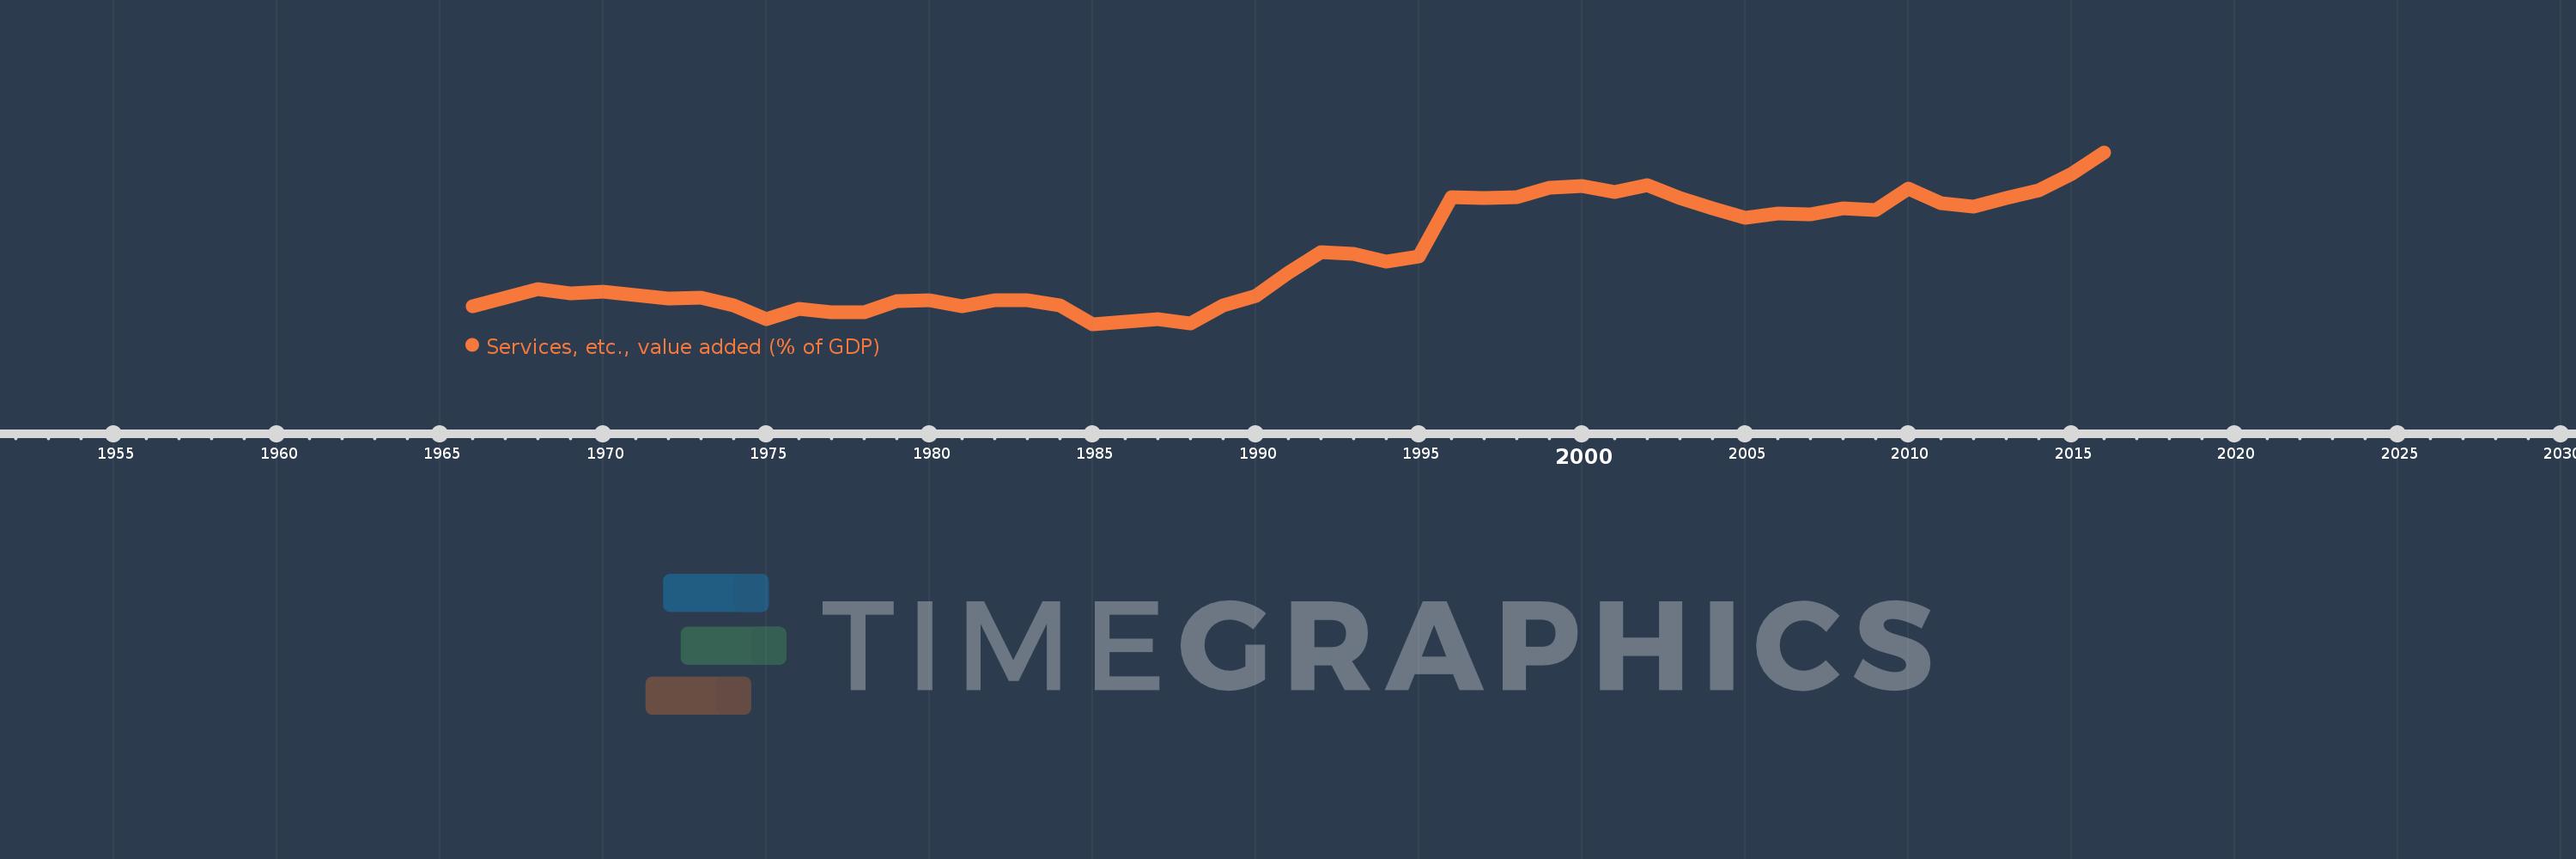
Services, etc., value added (% of GDP)
2016,2015,2014,2013,2012,2011,2010,2009,2008,2007,2006,2005,2004,2003,2002,2001,2000,1999,1998,1997,1996,1995,1994,1993,1992,1991,1990,1989,1988,1987,1986,1985,1984,1983,1982,1981,1980,1979,1978,1977,1976,1975,1974,1973,1972,1971,1970,1969,1968,1967,1966
This statistics in other country:
AfghanistanAlbaniaAlgeriaAndorraAngolaAntigua and BarbudaArab WorldArgentinaArmeniaArubaAustraliaAustriaAzerbaijanBahamas, TheBahrainBangladeshBarbadosBelarusBelgiumBelizeBeninBermudaBhutanBoliviaBosnia and HerzegovinaBotswanaBrazilBrunei DarussalamBulgariaBurkina FasoBurundiCabo VerdeCambodiaCameroonCanadaCaribbean small statesCentral African RepublicCentral Europe and the BalticsChadChileChinaColombiaComorosCongo, Dem. Rep.Congo, Rep.Costa RicaCote d'IvoireCroatiaCubaCyprusCzech RepublicDenmarkDjiboutiDominicaDominican RepublicEarly-demographic dividendEast Asia & PacificEast Asia & Pacific (excluding high income)East Asia & Pacific (IDA & IBRD countries)EcuadorEgypt, Arab Rep.El SalvadorEquatorial GuineaEritreaEstoniaEthiopiaEuro areaEurope & Central AsiaEurope & Central Asia (excluding high income)Europe & Central Asia (IDA & IBRD countries)European UnionFaroe IslandsFijiFinlandFragile and conflict affected situationsFranceGabonGambia, TheGeorgiaGermanyGhanaGreeceGrenadaGuatemalaGuineaGuinea-BissauGuyanaHeavily indebted poor countries (HIPC)High incomeHondurasHong Kong SAR, ChinaHungaryIBRD onlyIcelandIDA & IBRD totalIDA blendIDA onlyIDA totalIndiaIndonesiaIran, Islamic Rep.IrelandItalyJamaicaJapanJordanKazakhstanKenyaKiribatiKorea, Rep.KosovoKuwaitKyrgyz RepublicLao PDRLate-demographic dividendLatin America & Caribbean Latin America & Caribbean (excluding high income)Latin America & the Caribbean (IDA & IBRD countries)LatviaLeast developed countries: UN classificationLebanonLesothoLibyaLithuaniaLow & middle incomeLow incomeLower middle incomeLuxembourgMacao SAR, ChinaMacedonia, FYRMadagascarMalawiMalaysiaMaldivesMaliMaltaMarshall IslandsMauritaniaMauritiusMexicoMicronesia, Fed. Sts.Middle East & North AfricaMiddle East & North Africa (excluding high income)Middle East & North Africa (IDA & IBRD countries)Middle incomeMoldovaMongoliaMontenegroMoroccoMozambiqueMyanmarNamibiaNepalNetherlandsNew CaledoniaNew ZealandNicaraguaNigerNigeriaNorth AmericaNorwayOECD membersOmanOther small statesPacific island small statesPakistanPalauPanamaPapua New GuineaParaguayPeruPhilippinesPolandPortugalPost-demographic dividendPre-demographic dividendPuerto RicoQatarRomaniaRussian FederationRwandaSao Tome and PrincipeSaudi ArabiaSenegalSerbiaSeychellesSierra LeoneSingaporeSlovak RepublicSloveniaSmall statesSolomon IslandsSomaliaSouth AfricaSouth AsiaSouth Asia (IDA & IBRD)SpainSri LankaSt. Kitts and NevisSt. LuciaSt. Vincent and the GrenadinesSub-Saharan Africa Sub-Saharan Africa (excluding high income)Sub-Saharan Africa (IDA & IBRD countries)SudanSurinameSwazilandSwedenSwitzerlandSyrian Arab RepublicTajikistanTanzaniaThailandTimor-LesteTogoTongaTrinidad and TobagoTunisiaTurkeyTurkmenistanTuvaluUgandaUkraineUnited KingdomUnited StatesUpper middle incomeUruguayUzbekistanVanuatuVenezuela, RBVietnamWest Bank and GazaWorldYemen, Rep.ZambiaZimbabwe Timeline:
This timeline shows a graph from 1966 to 2016 of Latin America & Caribbean . No data until 1965. Number of actual observations by date: 51.
Source name:
World Development Indicators
Source organization:
World Bank national accounts data, and OECD National Accounts data files.
Categories, topics:
Economy & Growth
Last updated:
apr 23, 2017
Indicators value changes by year
Minimum:
47.881
jan 1, 1985
Maximum:
67.119
jan 1, 2016
At the date of observation
Value
Absolute change
Change from previous value
jan 1, 1966
49.851
+49.851
0.0%
jan 1, 1967
50.878
+1.026
2.06%
jan 1, 1968
51.798
+0.921
1.81%
jan 1, 1969
51.314
-0.485
-0.94%
jan 1, 1970
51.495
+0.181
0.35%
jan 1, 1971
51.106
-0.389
-0.76%
jan 1, 1972
50.774
-0.332
-0.65%
jan 1, 1973
50.861
+0.087
0.17%
jan 1, 1974
49.944
-0.917
-1.8%
jan 1, 1975
48.466
-1.477
-2.96%
jan 1, 1976
49.623
+1.157
2.39%
jan 1, 1977
49.177
-0.447
-0.9%
jan 1, 1978
49.181
+0.005
0.01%
jan 1, 1979
50.455
+1.274
2.59%
jan 1, 1980
50.535
+0.08
0.16%
jan 1, 1981
49.866
-0.67
-1.32%
jan 1, 1982
50.569
+0.703
1.41%
jan 1, 1983
50.582
+0.013
0.03%
jan 1, 1984
49.961
-0.621
-1.23%
jan 1, 1985
47.881
-2.08
-4.16%
jan 1, 1986
48.199
+0.318
0.66%
jan 1, 1987
48.44
+0.242
0.5%
jan 1, 1988
48.015
-0.425
-0.88%
jan 1, 1989
50.006
+1.99
4.15%
jan 1, 1990
51.001
+0.996
1.99%
jan 1, 1991
53.656
+2.655
5.21%
jan 1, 1992
55.919
+2.263
4.22%
jan 1, 1993
55.787
-0.132
-0.24%
jan 1, 1994
54.883
-0.904
-1.62%
jan 1, 1995
55.457
+0.575
1.05%
jan 1, 1996
62.061
+6.603
11.91%
jan 1, 1997
61.988
-0.073
-0.12%
jan 1, 1998
62.089
+0.101
0.16%
jan 1, 1999
63.136
+1.047
1.69%
jan 1, 2000
63.347
+0.211
0.33%
jan 1, 2001
62.643
-0.704
-1.11%
jan 1, 2002
63.445
+0.801
1.28%
jan 1, 2003
61.982
-1.463
-2.31%
jan 1, 2004
60.809
-1.173
-1.89%
jan 1, 2005
59.781
-1.027
-1.69%
jan 1, 2006
60.267
+0.486
0.81%
jan 1, 2007
60.223
-0.044
-0.07%
jan 1, 2008
60.839
+0.616
1.02%
jan 1, 2009
60.694
-0.146
-0.24%
jan 1, 2010
63.056
+2.362
3.89%
jan 1, 2011
61.439
-1.616
-2.56%
jan 1, 2012
61.002
-0.438
-0.71%
jan 1, 2013
61.996
+0.994
1.63%
jan 1, 2014
62.903
+0.907
1.46%
jan 1, 2015
64.678
+1.775
2.82%
jan 1, 2016
67.119
+2.442
3.77%
Ranking of countries by current statistics by years


Comments: