29
/
en
AIzaSyAYiBZKx7MnpbEhh9jyipgxe19OcubqV5w
April 1, 2024
106642
China
CHN
true
2
1
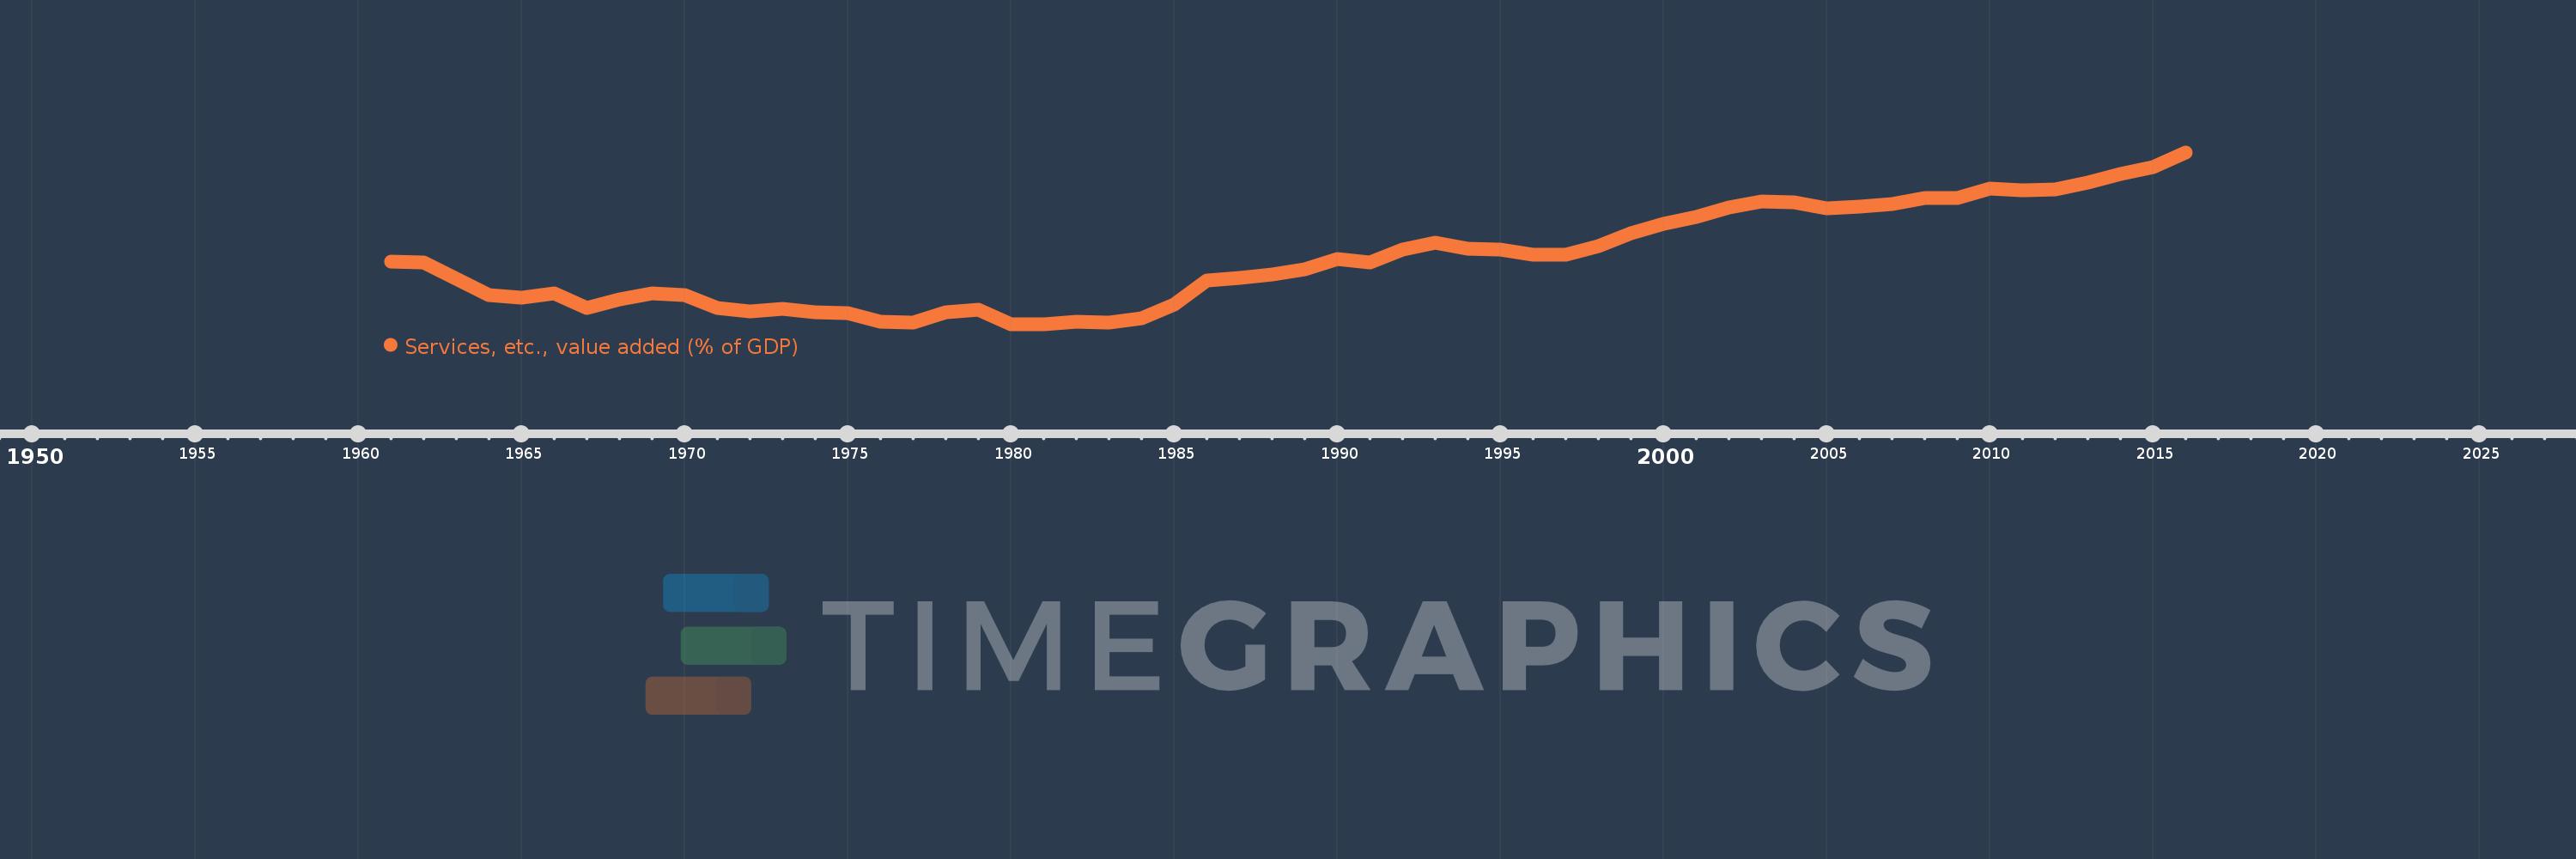
Services, etc., value added (% of GDP)
2016,2015,2014,2013,2012,2011,2010,2009,2008,2007,2006,2005,2004,2003,2002,2001,2000,1999,1998,1997,1996,1995,1994,1993,1992,1991,1990,1989,1988,1987,1986,1985,1984,1983,1982,1981,1980,1979,1978,1977,1976,1975,1974,1973,1972,1971,1970,1969,1968,1967,1966,1965,1964,1963,1962,1961
This statistics in other country:
AfghanistanAlbaniaAlgeriaAndorraAngolaAntigua and BarbudaArab WorldArgentinaArmeniaArubaAustraliaAustriaAzerbaijanBahamas, TheBahrainBangladeshBarbadosBelarusBelgiumBelizeBeninBermudaBhutanBoliviaBosnia and HerzegovinaBotswanaBrazilBrunei DarussalamBulgariaBurkina FasoBurundiCabo VerdeCambodiaCameroonCanadaCaribbean small statesCentral African RepublicCentral Europe and the BalticsChadChileChinaColombiaComorosCongo, Dem. Rep.Congo, Rep.Costa RicaCote d'IvoireCroatiaCubaCyprusCzech RepublicDenmarkDjiboutiDominicaDominican RepublicEarly-demographic dividendEast Asia & PacificEast Asia & Pacific (excluding high income)East Asia & Pacific (IDA & IBRD countries)EcuadorEgypt, Arab Rep.El SalvadorEquatorial GuineaEritreaEstoniaEthiopiaEuro areaEurope & Central AsiaEurope & Central Asia (excluding high income)Europe & Central Asia (IDA & IBRD countries)European UnionFaroe IslandsFijiFinlandFragile and conflict affected situationsFranceGabonGambia, TheGeorgiaGermanyGhanaGreeceGrenadaGuatemalaGuineaGuinea-BissauGuyanaHeavily indebted poor countries (HIPC)High incomeHondurasHong Kong SAR, ChinaHungaryIBRD onlyIcelandIDA & IBRD totalIDA blendIDA onlyIDA totalIndiaIndonesiaIran, Islamic Rep.IrelandItalyJamaicaJapanJordanKazakhstanKenyaKiribatiKorea, Rep.KosovoKuwaitKyrgyz RepublicLao PDRLate-demographic dividendLatin America & Caribbean Latin America & Caribbean (excluding high income)Latin America & the Caribbean (IDA & IBRD countries)LatviaLeast developed countries: UN classificationLebanonLesothoLibyaLithuaniaLow & middle incomeLow incomeLower middle incomeLuxembourgMacao SAR, ChinaMacedonia, FYRMadagascarMalawiMalaysiaMaldivesMaliMaltaMarshall IslandsMauritaniaMauritiusMexicoMicronesia, Fed. Sts.Middle East & North AfricaMiddle East & North Africa (excluding high income)Middle East & North Africa (IDA & IBRD countries)Middle incomeMoldovaMongoliaMontenegroMoroccoMozambiqueMyanmarNamibiaNepalNetherlandsNew CaledoniaNew ZealandNicaraguaNigerNigeriaNorth AmericaNorwayOECD membersOmanOther small statesPacific island small statesPakistanPalauPanamaPapua New GuineaParaguayPeruPhilippinesPolandPortugalPost-demographic dividendPre-demographic dividendPuerto RicoQatarRomaniaRussian FederationRwandaSao Tome and PrincipeSaudi ArabiaSenegalSerbiaSeychellesSierra LeoneSingaporeSlovak RepublicSloveniaSmall statesSolomon IslandsSomaliaSouth AfricaSouth AsiaSouth Asia (IDA & IBRD)SpainSri LankaSt. Kitts and NevisSt. LuciaSt. Vincent and the GrenadinesSub-Saharan Africa Sub-Saharan Africa (excluding high income)Sub-Saharan Africa (IDA & IBRD countries)SudanSurinameSwazilandSwedenSwitzerlandSyrian Arab RepublicTajikistanTanzaniaThailandTimor-LesteTogoTongaTrinidad and TobagoTunisiaTurkeyTurkmenistanTuvaluUgandaUkraineUnited KingdomUnited StatesUpper middle incomeUruguayUzbekistanVanuatuVenezuela, RBVietnamWest Bank and GazaWorldYemen, Rep.ZambiaZimbabwe Timeline:
This timeline shows a graph from 1961 to 2016 of China. No data until 1960. Number of actual observations by date: 56.
Source name:
World Development Indicators
Source organization:
World Bank national accounts data, and OECD National Accounts data files.
Categories, topics:
Economy & Growth
Last updated:
apr 23, 2017
Indicators value changes by year
Minimum:
22.308
jan 1, 1981
Maximum:
50.193
jan 1, 2016
At the date of observation
Value
Absolute change
Change from previous value
jan 1, 1961
32.433
+32.433
0.0%
jan 1, 1962
32.273
-0.16
-0.49%
jan 1, 1963
29.694
-2.579
-7.99%
jan 1, 1964
27.069
-2.625
-8.84%
jan 1, 1965
26.641
-0.428
-1.58%
jan 1, 1966
27.359
+0.717
2.69%
jan 1, 1967
24.938
-2.421
-8.85%
jan 1, 1968
26.307
+1.369
5.49%
jan 1, 1969
27.246
+0.939
3.57%
jan 1, 1970
27.061
-0.185
-0.68%
jan 1, 1971
24.929
-2.133
-7.88%
jan 1, 1972
24.445
-0.483
-1.94%
jan 1, 1973
24.812
+0.367
1.5%
jan 1, 1974
24.247
-0.565
-2.28%
jan 1, 1975
24.143
-0.104
-0.43%
jan 1, 1976
22.688
-1.455
-6.03%
jan 1, 1977
22.603
-0.085
-0.38%
jan 1, 1978
24.308
+1.705
7.54%
jan 1, 1979
24.604
+0.296
1.22%
jan 1, 1980
22.341
-2.263
-9.2%
jan 1, 1981
22.308
-0.033
-0.15%
jan 1, 1982
22.714
+0.406
1.82%
jan 1, 1983
22.593
-0.121
-0.53%
jan 1, 1984
23.203
+0.61
2.7%
jan 1, 1985
25.529
+2.326
10.03%
jan 1, 1986
29.352
+3.823
14.98%
jan 1, 1987
29.846
+0.494
1.68%
jan 1, 1988
30.36
+0.514
1.72%
jan 1, 1989
31.236
+0.876
2.89%
jan 1, 1990
32.891
+1.655
5.3%
jan 1, 1991
32.382
-0.509
-1.55%
jan 1, 1992
34.478
+2.096
6.47%
jan 1, 1993
35.555
+1.077
3.12%
jan 1, 1994
34.515
-1.04
-2.92%
jan 1, 1995
34.361
-0.154
-0.45%
jan 1, 1996
33.652
-0.71
-2.07%
jan 1, 1997
33.569
-0.083
-0.25%
jan 1, 1998
35.004
+1.435
4.28%
jan 1, 1999
37.042
+2.038
5.82%
jan 1, 2000
38.574
+1.532
4.14%
jan 1, 2001
39.786
+1.212
3.14%
jan 1, 2002
41.222
+1.436
3.61%
jan 1, 2003
42.247
+1.025
2.49%
jan 1, 2004
42.027
-0.22
-0.52%
jan 1, 2005
41.182
-0.845
-2.01%
jan 1, 2006
41.335
+0.153
0.37%
jan 1, 2007
41.816
+0.481
1.16%
jan 1, 2008
42.856
+1.04
2.49%
jan 1, 2009
42.817
-0.039
-0.09%
jan 1, 2010
44.33
+1.513
3.53%
jan 1, 2011
44.074
-0.256
-0.58%
jan 1, 2012
44.165
+0.091
0.21%
jan 1, 2013
45.307
+1.142
2.59%
jan 1, 2014
46.697
+1.39
3.07%
jan 1, 2015
47.837
+1.14
2.44%
jan 1, 2016
50.193
+2.356
4.92%
Ranking of countries by current statistics by years


Comments: