29
/
en
AIzaSyAYiBZKx7MnpbEhh9jyipgxe19OcubqV5w
April 1, 2024
255819
Swaziland
SWZ
true
2
1
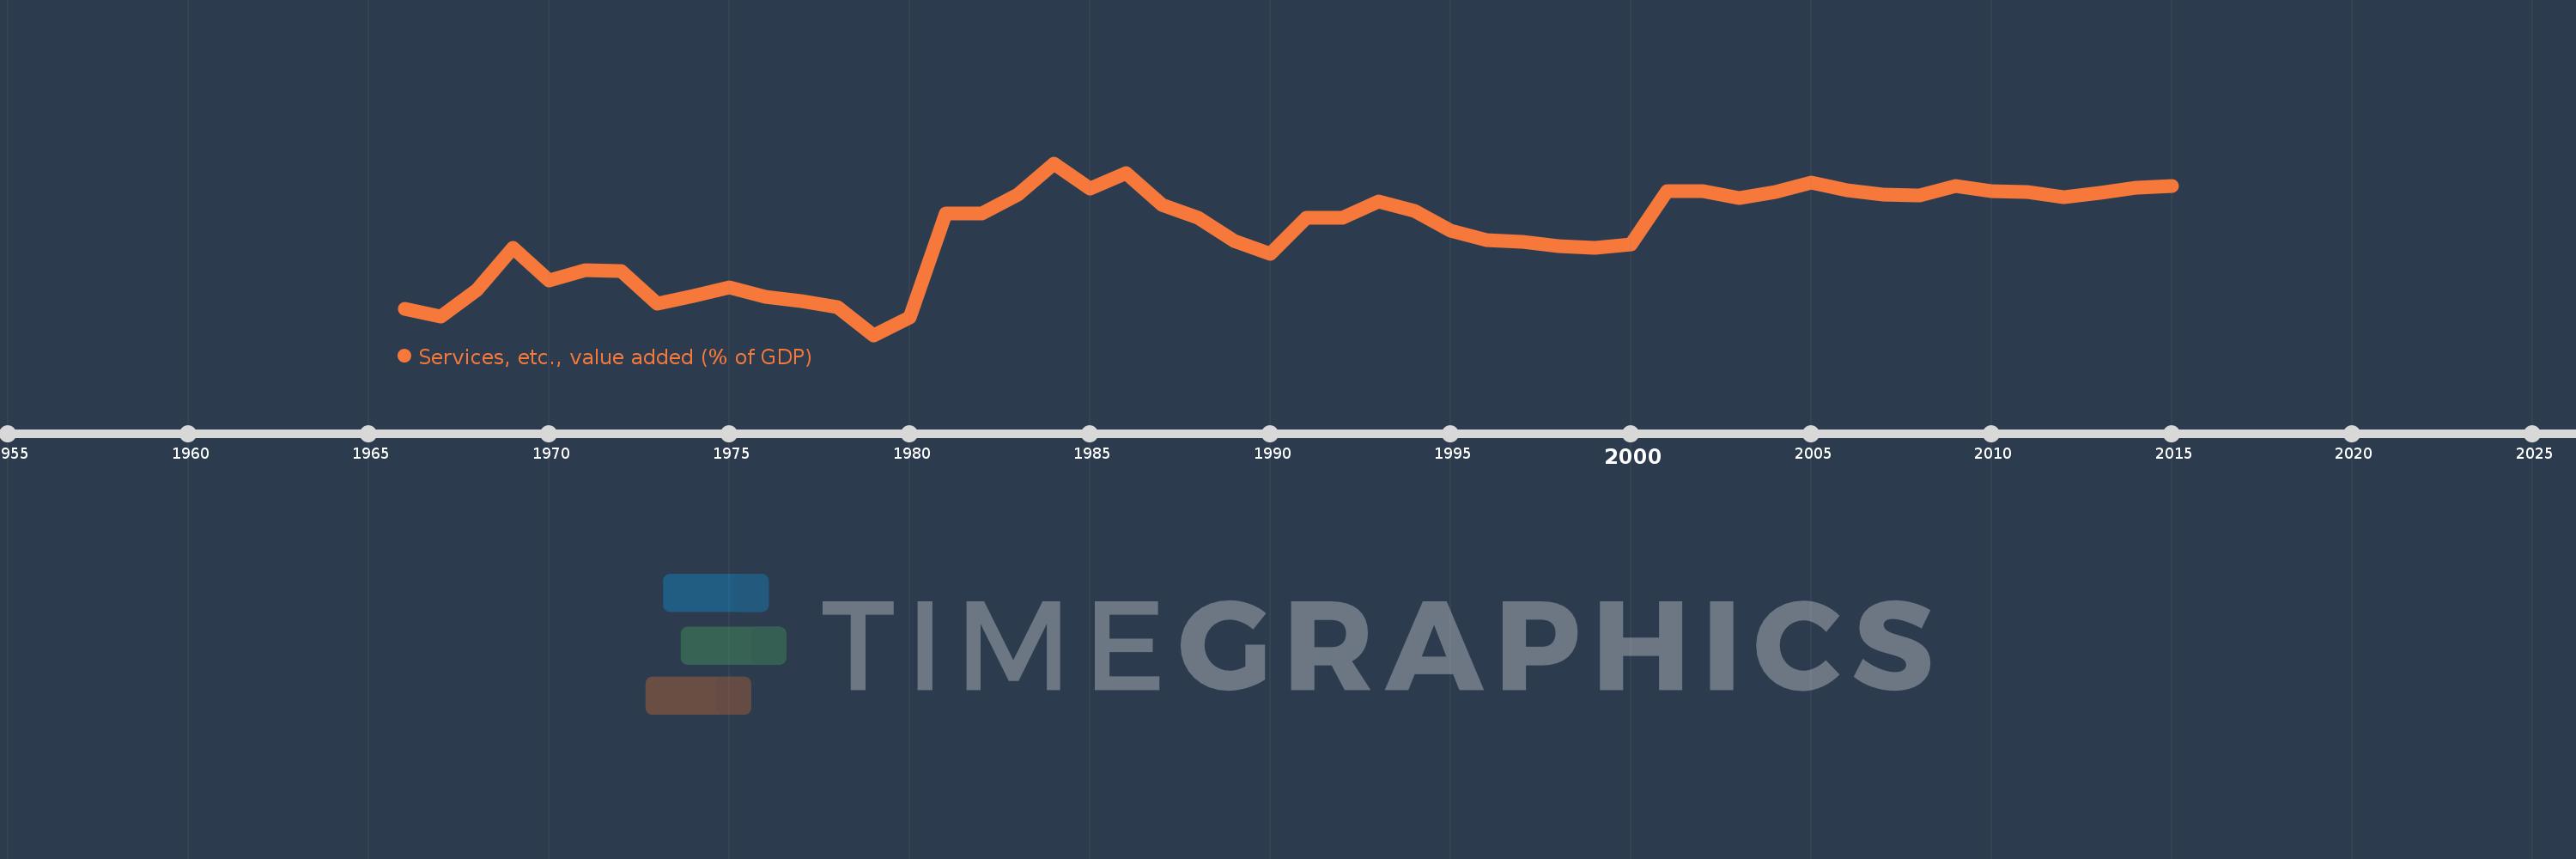
Services, etc., value added (% of GDP)
2015,2014,2013,2012,2011,2010,2009,2008,2007,2006,2005,2004,2003,2002,2001,2000,1999,1998,1997,1996,1995,1994,1993,1992,1991,1990,1989,1988,1987,1986,1985,1984,1983,1982,1981,1980,1979,1978,1977,1976,1975,1974,1973,1972,1971,1970,1969,1968,1967,1966
This statistics in other country:
AfghanistanAlbaniaAlgeriaAndorraAngolaAntigua and BarbudaArab WorldArgentinaArmeniaArubaAustraliaAustriaAzerbaijanBahamas, TheBahrainBangladeshBarbadosBelarusBelgiumBelizeBeninBermudaBhutanBoliviaBosnia and HerzegovinaBotswanaBrazilBrunei DarussalamBulgariaBurkina FasoBurundiCabo VerdeCambodiaCameroonCanadaCaribbean small statesCentral African RepublicCentral Europe and the BalticsChadChileChinaColombiaComorosCongo, Dem. Rep.Congo, Rep.Costa RicaCote d'IvoireCroatiaCubaCyprusCzech RepublicDenmarkDjiboutiDominicaDominican RepublicEarly-demographic dividendEast Asia & PacificEast Asia & Pacific (excluding high income)East Asia & Pacific (IDA & IBRD countries)EcuadorEgypt, Arab Rep.El SalvadorEquatorial GuineaEritreaEstoniaEthiopiaEuro areaEurope & Central AsiaEurope & Central Asia (excluding high income)Europe & Central Asia (IDA & IBRD countries)European UnionFaroe IslandsFijiFinlandFragile and conflict affected situationsFranceGabonGambia, TheGeorgiaGermanyGhanaGreeceGrenadaGuatemalaGuineaGuinea-BissauGuyanaHeavily indebted poor countries (HIPC)High incomeHondurasHong Kong SAR, ChinaHungaryIBRD onlyIcelandIDA & IBRD totalIDA blendIDA onlyIDA totalIndiaIndonesiaIran, Islamic Rep.IrelandItalyJamaicaJapanJordanKazakhstanKenyaKiribatiKorea, Rep.KosovoKuwaitKyrgyz RepublicLao PDRLate-demographic dividendLatin America & Caribbean Latin America & Caribbean (excluding high income)Latin America & the Caribbean (IDA & IBRD countries)LatviaLeast developed countries: UN classificationLebanonLesothoLibyaLithuaniaLow & middle incomeLow incomeLower middle incomeLuxembourgMacao SAR, ChinaMacedonia, FYRMadagascarMalawiMalaysiaMaldivesMaliMaltaMarshall IslandsMauritaniaMauritiusMexicoMicronesia, Fed. Sts.Middle East & North AfricaMiddle East & North Africa (excluding high income)Middle East & North Africa (IDA & IBRD countries)Middle incomeMoldovaMongoliaMontenegroMoroccoMozambiqueMyanmarNamibiaNepalNetherlandsNew CaledoniaNew ZealandNicaraguaNigerNigeriaNorth AmericaNorwayOECD membersOmanOther small statesPacific island small statesPakistanPalauPanamaPapua New GuineaParaguayPeruPhilippinesPolandPortugalPost-demographic dividendPre-demographic dividendPuerto RicoQatarRomaniaRussian FederationRwandaSao Tome and PrincipeSaudi ArabiaSenegalSerbiaSeychellesSierra LeoneSingaporeSlovak RepublicSloveniaSmall statesSolomon IslandsSomaliaSouth AfricaSouth AsiaSouth Asia (IDA & IBRD)SpainSri LankaSt. Kitts and NevisSt. LuciaSt. Vincent and the GrenadinesSub-Saharan Africa Sub-Saharan Africa (excluding high income)Sub-Saharan Africa (IDA & IBRD countries)SudanSurinameSwazilandSwedenSwitzerlandSyrian Arab RepublicTajikistanTanzaniaThailandTimor-LesteTogoTongaTrinidad and TobagoTunisiaTurkeyTurkmenistanTuvaluUgandaUkraineUnited KingdomUnited StatesUpper middle incomeUruguayUzbekistanVanuatuVenezuela, RBVietnamWest Bank and GazaWorldYemen, Rep.ZambiaZimbabwe Timeline:
This timeline shows a graph from 1966 to 2015 of Swaziland. No data until 1965. Number of actual observations by date: 50.
Source name:
World Development Indicators
Source organization:
World Bank national accounts data, and OECD National Accounts data files.
Categories, topics:
Economy & Growth
Last updated:
apr 23, 2017
Indicators value changes by year
Minimum:
28.244
jan 1, 1979
Maximum:
54.868
jan 1, 1984
At the date of observation
Value
Absolute change
Change from previous value
jan 1, 1966
32.359
+32.359
0.0%
jan 1, 1967
31.107
-1.252
-3.87%
jan 1, 1968
35.178
+4.071
13.09%
jan 1, 1969
41.758
+6.58
18.71%
jan 1, 1970
36.701
-5.057
-12.11%
jan 1, 1971
38.324
+1.623
4.42%
jan 1, 1972
38.209
-0.116
-0.3%
jan 1, 1973
33.07
-5.139
-13.45%
jan 1, 1974
34.348
+1.278
3.86%
jan 1, 1975
35.587
+1.239
3.61%
jan 1, 1976
34.161
-1.425
-4.0%
jan 1, 1977
33.511
-0.651
-1.91%
jan 1, 1978
32.558
-0.952
-2.84%
jan 1, 1979
28.244
-4.314
-13.25%
jan 1, 1980
31.0
+2.756
9.76%
jan 1, 1981
47.109
+16.109
51.96%
jan 1, 1982
47.109
+0.0
0.0%
jan 1, 1983
50.0
+2.891
6.14%
jan 1, 1984
54.868
+4.868
9.74%
jan 1, 1985
50.919
-3.95
-7.2%
jan 1, 1986
53.333
+2.415
4.74%
jan 1, 1987
48.378
-4.956
-9.29%
jan 1, 1988
46.392
-1.985
-4.1%
jan 1, 1989
42.758
-3.635
-7.83%
jan 1, 1990
40.865
-1.893
-4.43%
jan 1, 1991
46.452
+5.587
13.67%
jan 1, 1992
46.384
-0.067
-0.15%
jan 1, 1993
48.936
+2.552
5.5%
jan 1, 1994
47.485
-1.451
-2.97%
jan 1, 1995
44.404
-3.081
-6.49%
jan 1, 1996
43.004
-1.401
-3.15%
jan 1, 1997
42.629
-0.374
-0.87%
jan 1, 1998
42.017
-0.612
-1.44%
jan 1, 1999
41.788
-0.229
-0.54%
jan 1, 2000
42.308
+0.52
1.24%
jan 1, 2001
50.603
+8.294
19.6%
jan 1, 2002
50.563
-0.04
-0.08%
jan 1, 2003
49.452
-1.111
-2.2%
jan 1, 2004
50.4
+0.948
1.92%
jan 1, 2005
51.93
+1.53
3.04%
jan 1, 2006
50.64
-1.29
-2.48%
jan 1, 2007
49.977
-0.663
-1.31%
jan 1, 2008
49.896
-0.081
-0.16%
jan 1, 2009
51.375
+1.479
2.97%
jan 1, 2010
50.586
-0.789
-1.54%
jan 1, 2011
50.455
-0.131
-0.26%
jan 1, 2012
49.563
-0.892
-1.77%
jan 1, 2013
50.247
+0.684
1.38%
jan 1, 2014
51.108
+0.861
1.71%
jan 1, 2015
51.342
+0.234
0.46%
Ranking of countries by current statistics by years


Comments: