29
/
en
AIzaSyAYiBZKx7MnpbEhh9jyipgxe19OcubqV5w
April 1, 2024
164253
Japan
JPN
true
2
1
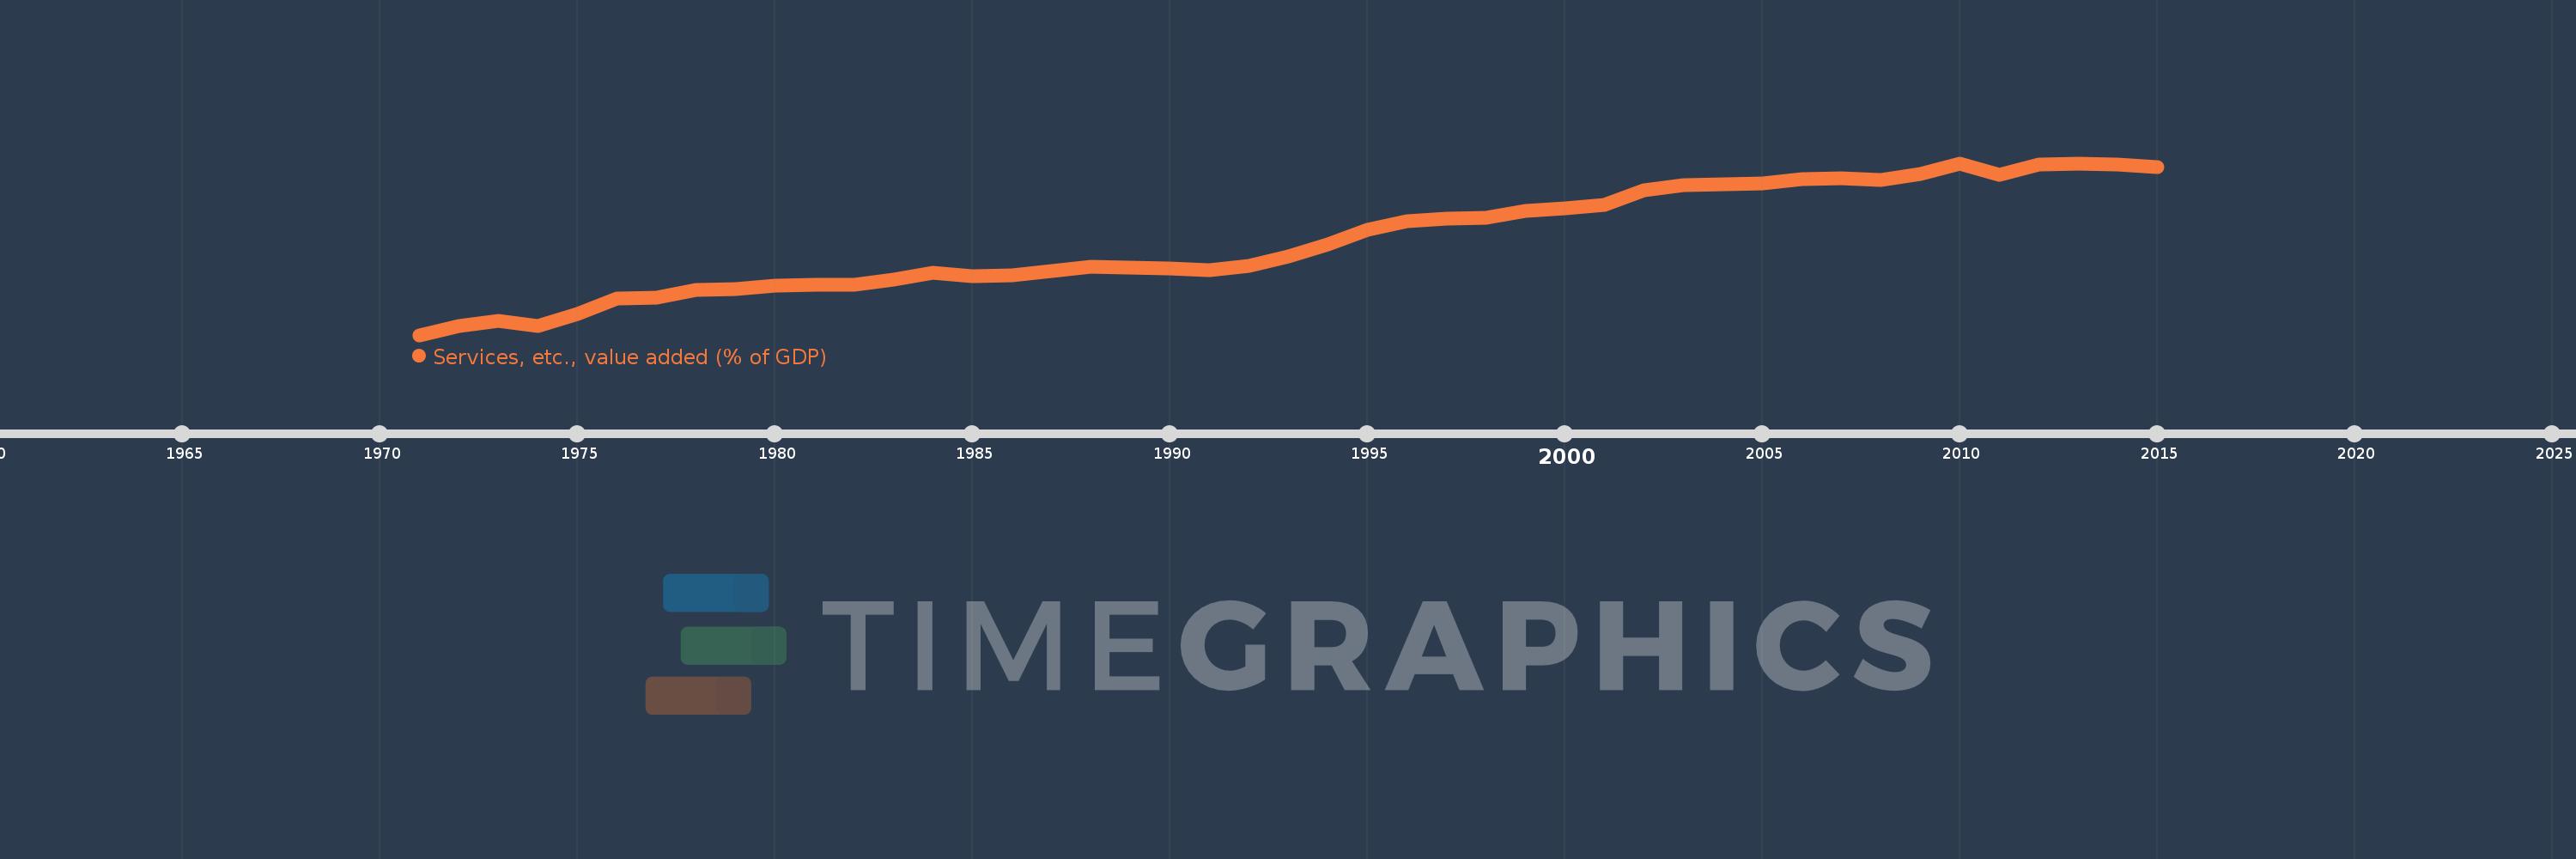
Services, etc., value added (% of GDP)
2015,2014,2013,2012,2011,2010,2009,2008,2007,2006,2005,2004,2003,2002,2001,2000,1999,1998,1997,1996,1995,1994,1993,1992,1991,1990,1989,1988,1987,1986,1985,1984,1983,1982,1981,1980,1979,1978,1977,1976,1975,1974,1973,1972,1971
This statistics in other country:
AfghanistanAlbaniaAlgeriaAndorraAngolaAntigua and BarbudaArab WorldArgentinaArmeniaArubaAustraliaAustriaAzerbaijanBahamas, TheBahrainBangladeshBarbadosBelarusBelgiumBelizeBeninBermudaBhutanBoliviaBosnia and HerzegovinaBotswanaBrazilBrunei DarussalamBulgariaBurkina FasoBurundiCabo VerdeCambodiaCameroonCanadaCaribbean small statesCentral African RepublicCentral Europe and the BalticsChadChileChinaColombiaComorosCongo, Dem. Rep.Congo, Rep.Costa RicaCote d'IvoireCroatiaCubaCyprusCzech RepublicDenmarkDjiboutiDominicaDominican RepublicEarly-demographic dividendEast Asia & PacificEast Asia & Pacific (excluding high income)East Asia & Pacific (IDA & IBRD countries)EcuadorEgypt, Arab Rep.El SalvadorEquatorial GuineaEritreaEstoniaEthiopiaEuro areaEurope & Central AsiaEurope & Central Asia (excluding high income)Europe & Central Asia (IDA & IBRD countries)European UnionFaroe IslandsFijiFinlandFragile and conflict affected situationsFranceGabonGambia, TheGeorgiaGermanyGhanaGreeceGrenadaGuatemalaGuineaGuinea-BissauGuyanaHeavily indebted poor countries (HIPC)High incomeHondurasHong Kong SAR, ChinaHungaryIBRD onlyIcelandIDA & IBRD totalIDA blendIDA onlyIDA totalIndiaIndonesiaIran, Islamic Rep.IrelandItalyJamaicaJapanJordanKazakhstanKenyaKiribatiKorea, Rep.KosovoKuwaitKyrgyz RepublicLao PDRLate-demographic dividendLatin America & Caribbean Latin America & Caribbean (excluding high income)Latin America & the Caribbean (IDA & IBRD countries)LatviaLeast developed countries: UN classificationLebanonLesothoLibyaLithuaniaLow & middle incomeLow incomeLower middle incomeLuxembourgMacao SAR, ChinaMacedonia, FYRMadagascarMalawiMalaysiaMaldivesMaliMaltaMarshall IslandsMauritaniaMauritiusMexicoMicronesia, Fed. Sts.Middle East & North AfricaMiddle East & North Africa (excluding high income)Middle East & North Africa (IDA & IBRD countries)Middle incomeMoldovaMongoliaMontenegroMoroccoMozambiqueMyanmarNamibiaNepalNetherlandsNew CaledoniaNew ZealandNicaraguaNigerNigeriaNorth AmericaNorwayOECD membersOmanOther small statesPacific island small statesPakistanPalauPanamaPapua New GuineaParaguayPeruPhilippinesPolandPortugalPost-demographic dividendPre-demographic dividendPuerto RicoQatarRomaniaRussian FederationRwandaSao Tome and PrincipeSaudi ArabiaSenegalSerbiaSeychellesSierra LeoneSingaporeSlovak RepublicSloveniaSmall statesSolomon IslandsSomaliaSouth AfricaSouth AsiaSouth Asia (IDA & IBRD)SpainSri LankaSt. Kitts and NevisSt. LuciaSt. Vincent and the GrenadinesSub-Saharan Africa Sub-Saharan Africa (excluding high income)Sub-Saharan Africa (IDA & IBRD countries)SudanSurinameSwazilandSwedenSwitzerlandSyrian Arab RepublicTajikistanTanzaniaThailandTimor-LesteTogoTongaTrinidad and TobagoTunisiaTurkeyTurkmenistanTuvaluUgandaUkraineUnited KingdomUnited StatesUpper middle incomeUruguayUzbekistanVanuatuVenezuela, RBVietnamWest Bank and GazaWorldYemen, Rep.ZambiaZimbabwe Timeline:
This timeline shows a graph from 1971 to 2015 of Japan. No data until 1970. Number of actual observations by date: 45.
Source name:
World Development Indicators
Source organization:
World Bank national accounts data, and OECD National Accounts data files.
Categories, topics:
Economy & Growth
Last updated:
apr 23, 2017
Indicators value changes by year
Minimum:
51.188
jan 1, 1971
Maximum:
73.919
jan 1, 2010
At the date of observation
Value
Absolute change
Change from previous value
jan 1, 1971
51.188
+51.188
0.0%
jan 1, 1972
52.328
+1.141
2.23%
jan 1, 1973
53.096
+0.767
1.47%
jan 1, 1974
52.391
-0.704
-1.33%
jan 1, 1975
53.983
+1.591
3.04%
jan 1, 1976
56.007
+2.024
3.75%
jan 1, 1977
56.167
+0.16
0.29%
jan 1, 1978
57.107
+0.94
1.67%
jan 1, 1979
57.223
+0.116
0.2%
jan 1, 1980
57.717
+0.494
0.86%
jan 1, 1981
57.859
+0.142
0.25%
jan 1, 1982
57.812
-0.047
-0.08%
jan 1, 1983
58.556
+0.744
1.29%
jan 1, 1984
59.408
+0.852
1.45%
jan 1, 1985
59.022
-0.386
-0.65%
jan 1, 1986
59.074
+0.051
0.09%
jan 1, 1987
59.674
+0.6
1.02%
jan 1, 1988
60.271
+0.596
1.0%
jan 1, 1989
60.124
-0.146
-0.24%
jan 1, 1990
60.032
-0.092
-0.15%
jan 1, 1991
59.825
-0.207
-0.35%
jan 1, 1992
60.329
+0.504
0.84%
jan 1, 1993
61.583
+1.255
2.08%
jan 1, 1994
63.123
+1.54
2.5%
jan 1, 1995
65.083
+1.96
3.11%
jan 1, 1996
66.289
+1.206
1.85%
jan 1, 1997
66.569
+0.28
0.42%
jan 1, 1998
66.72
+0.151
0.23%
jan 1, 1999
67.617
+0.896
1.34%
jan 1, 2000
67.939
+0.322
0.48%
jan 1, 2001
68.461
+0.522
0.77%
jan 1, 2002
70.322
+1.861
2.72%
jan 1, 2003
71.006
+0.684
0.97%
jan 1, 2004
71.163
+0.157
0.22%
jan 1, 2005
71.292
+0.129
0.18%
jan 1, 2006
71.863
+0.572
0.8%
jan 1, 2007
71.889
+0.026
0.04%
jan 1, 2008
71.74
-0.15
-0.21%
jan 1, 2009
72.505
+0.766
1.07%
jan 1, 2010
73.919
+1.414
1.95%
jan 1, 2011
72.396
-1.523
-2.06%
jan 1, 2012
73.79
+1.394
1.93%
jan 1, 2013
73.824
+0.033
0.05%
jan 1, 2014
73.765
-0.059
-0.08%
jan 1, 2015
73.415
-0.351
-0.48%
Ranking of countries by current statistics by years


Comments: