29
/
en
AIzaSyAYiBZKx7MnpbEhh9jyipgxe19OcubqV5w
April 1, 2024
138755
Georgia
GEO
true
2
1
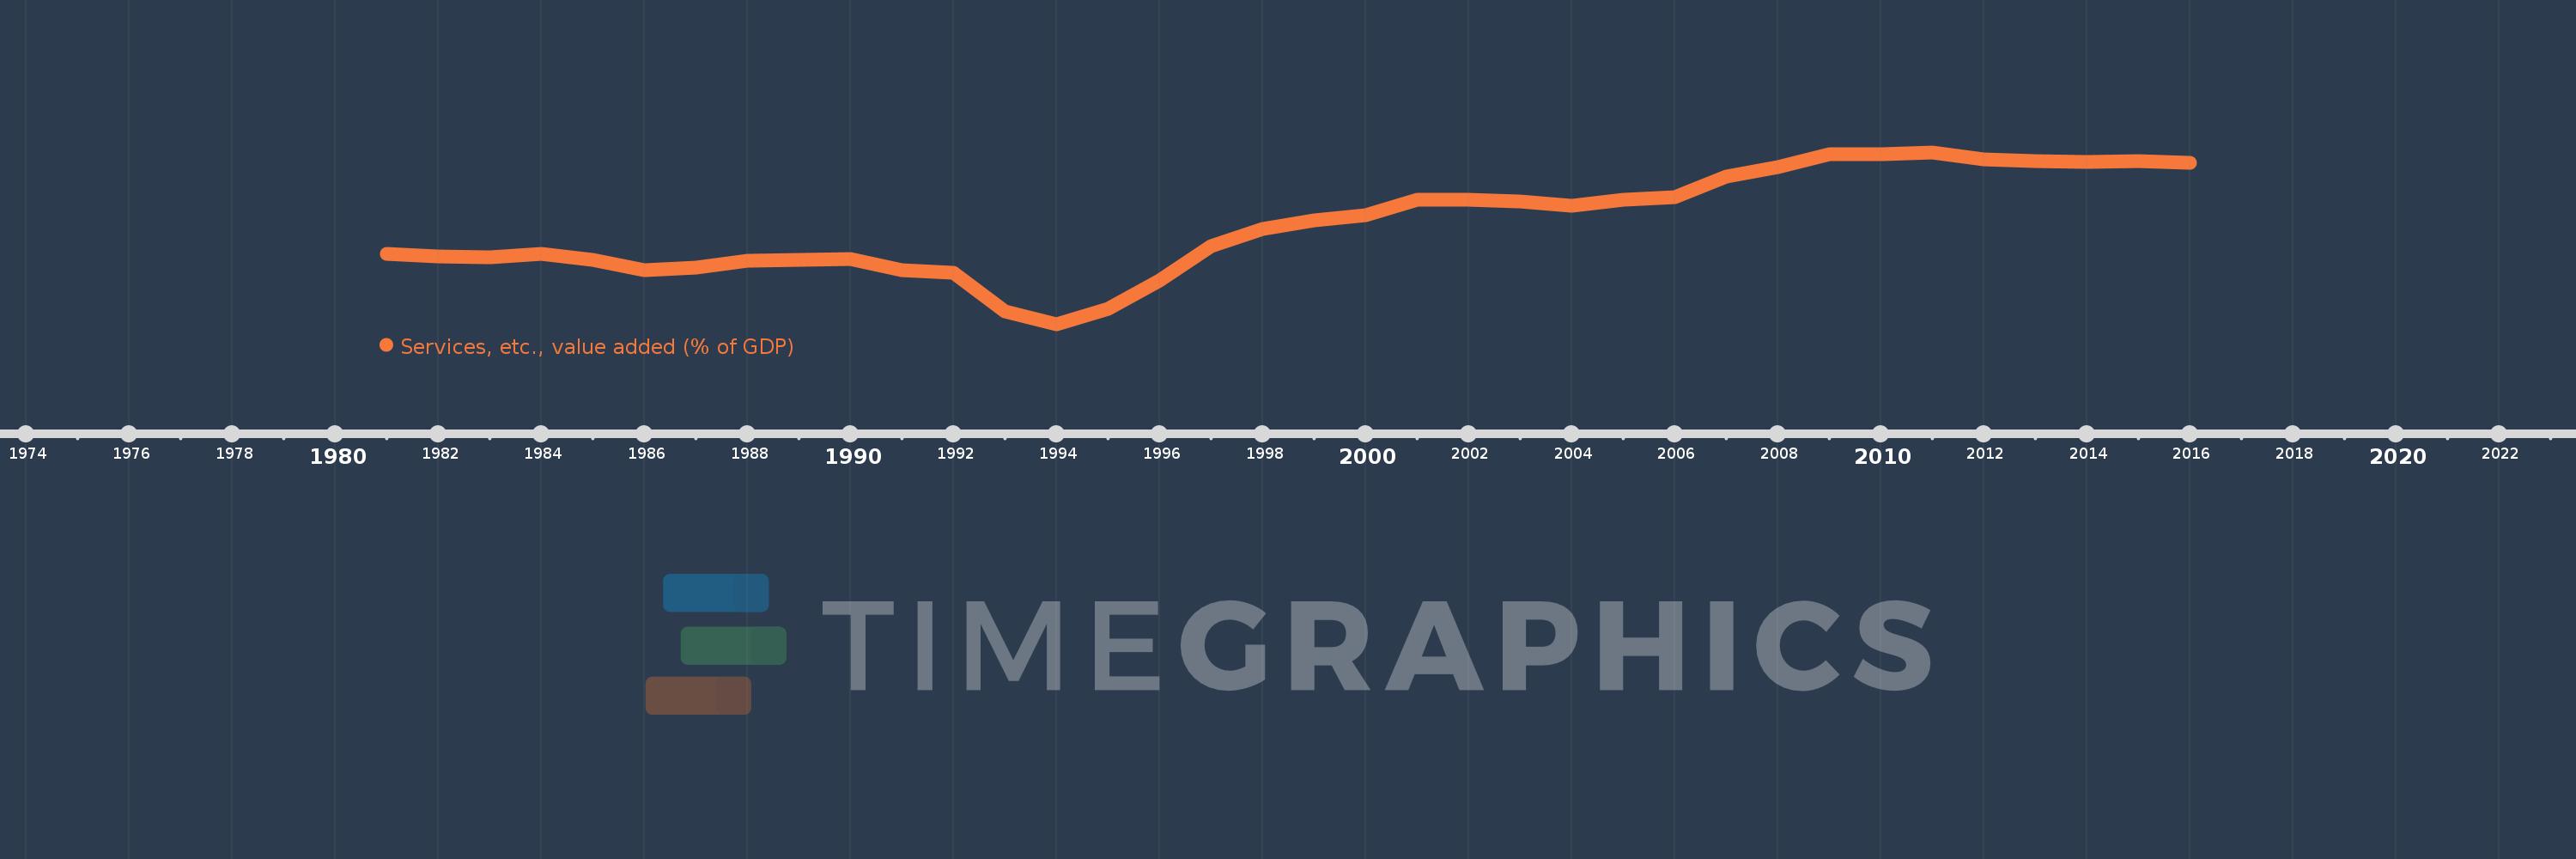
Services, etc., value added (% of GDP)
2016,2015,2014,2013,2012,2011,2010,2009,2008,2007,2006,2005,2004,2003,2002,2001,2000,1999,1998,1997,1996,1995,1994,1993,1992,1991,1990,1989,1988,1987,1986,1985,1984,1983,1982,1981
This statistics in other country:
AfghanistanAlbaniaAlgeriaAndorraAngolaAntigua and BarbudaArab WorldArgentinaArmeniaArubaAustraliaAustriaAzerbaijanBahamas, TheBahrainBangladeshBarbadosBelarusBelgiumBelizeBeninBermudaBhutanBoliviaBosnia and HerzegovinaBotswanaBrazilBrunei DarussalamBulgariaBurkina FasoBurundiCabo VerdeCambodiaCameroonCanadaCaribbean small statesCentral African RepublicCentral Europe and the BalticsChadChileChinaColombiaComorosCongo, Dem. Rep.Congo, Rep.Costa RicaCote d'IvoireCroatiaCubaCyprusCzech RepublicDenmarkDjiboutiDominicaDominican RepublicEarly-demographic dividendEast Asia & PacificEast Asia & Pacific (excluding high income)East Asia & Pacific (IDA & IBRD countries)EcuadorEgypt, Arab Rep.El SalvadorEquatorial GuineaEritreaEstoniaEthiopiaEuro areaEurope & Central AsiaEurope & Central Asia (excluding high income)Europe & Central Asia (IDA & IBRD countries)European UnionFaroe IslandsFijiFinlandFragile and conflict affected situationsFranceGabonGambia, TheGeorgiaGermanyGhanaGreeceGrenadaGuatemalaGuineaGuinea-BissauGuyanaHeavily indebted poor countries (HIPC)High incomeHondurasHong Kong SAR, ChinaHungaryIBRD onlyIcelandIDA & IBRD totalIDA blendIDA onlyIDA totalIndiaIndonesiaIran, Islamic Rep.IrelandItalyJamaicaJapanJordanKazakhstanKenyaKiribatiKorea, Rep.KosovoKuwaitKyrgyz RepublicLao PDRLate-demographic dividendLatin America & Caribbean Latin America & Caribbean (excluding high income)Latin America & the Caribbean (IDA & IBRD countries)LatviaLeast developed countries: UN classificationLebanonLesothoLibyaLithuaniaLow & middle incomeLow incomeLower middle incomeLuxembourgMacao SAR, ChinaMacedonia, FYRMadagascarMalawiMalaysiaMaldivesMaliMaltaMarshall IslandsMauritaniaMauritiusMexicoMicronesia, Fed. Sts.Middle East & North AfricaMiddle East & North Africa (excluding high income)Middle East & North Africa (IDA & IBRD countries)Middle incomeMoldovaMongoliaMontenegroMoroccoMozambiqueMyanmarNamibiaNepalNetherlandsNew CaledoniaNew ZealandNicaraguaNigerNigeriaNorth AmericaNorwayOECD membersOmanOther small statesPacific island small statesPakistanPalauPanamaPapua New GuineaParaguayPeruPhilippinesPolandPortugalPost-demographic dividendPre-demographic dividendPuerto RicoQatarRomaniaRussian FederationRwandaSao Tome and PrincipeSaudi ArabiaSenegalSerbiaSeychellesSierra LeoneSingaporeSlovak RepublicSloveniaSmall statesSolomon IslandsSomaliaSouth AfricaSouth AsiaSouth Asia (IDA & IBRD)SpainSri LankaSt. Kitts and NevisSt. LuciaSt. Vincent and the GrenadinesSub-Saharan Africa Sub-Saharan Africa (excluding high income)Sub-Saharan Africa (IDA & IBRD countries)SudanSurinameSwazilandSwedenSwitzerlandSyrian Arab RepublicTajikistanTanzaniaThailandTimor-LesteTogoTongaTrinidad and TobagoTunisiaTurkeyTurkmenistanTuvaluUgandaUkraineUnited KingdomUnited StatesUpper middle incomeUruguayUzbekistanVanuatuVenezuela, RBVietnamWest Bank and GazaWorldYemen, Rep.ZambiaZimbabwe Timeline:
This timeline shows a graph from 1981 to 2016 of Georgia. No data until 1980. Number of actual observations by date: 36.
Source name:
World Development Indicators
Source organization:
World Bank national accounts data, and OECD National Accounts data files.
Categories, topics:
Economy & Growth
Last updated:
apr 23, 2017
Indicators value changes by year
Minimum:
19.431
jan 1, 1994
Maximum:
69.376
jan 1, 2011
At the date of observation
Value
Absolute change
Change from previous value
jan 1, 1981
40.0
+40.0
0.0%
jan 1, 1982
39.13
-0.87
-2.17%
jan 1, 1983
38.843
-0.287
-0.73%
jan 1, 1984
39.837
+0.994
2.56%
jan 1, 1985
38.168
-1.669
-4.19%
jan 1, 1986
35.115
-3.053
-8.0%
jan 1, 1987
35.938
+0.823
2.34%
jan 1, 1988
37.879
+1.941
5.4%
jan 1, 1989
38.235
+0.357
0.94%
jan 1, 1990
38.346
+0.111
0.29%
jan 1, 1991
35.211
-3.135
-8.17%
jan 1, 1992
34.27
-0.942
-2.67%
jan 1, 1993
23.171
-11.099
-32.39%
jan 1, 1994
19.431
-3.74
-16.14%
jan 1, 1995
23.845
+4.414
22.72%
jan 1, 1996
32.067
+8.221
34.48%
jan 1, 1997
42.136
+10.069
31.4%
jan 1, 1998
47.144
+5.008
11.89%
jan 1, 1999
49.543
+2.399
5.09%
jan 1, 2000
51.235
+1.692
3.41%
jan 1, 2001
55.711
+4.477
8.74%
jan 1, 2002
55.602
-0.11
-0.2%
jan 1, 2003
55.035
-0.567
-1.02%
jan 1, 2004
53.797
-1.238
-2.25%
jan 1, 2005
55.661
+1.865
3.47%
jan 1, 2006
56.465
+0.804
1.44%
jan 1, 2007
62.325
+5.86
10.38%
jan 1, 2008
64.996
+2.671
4.29%
jan 1, 2009
68.741
+3.745
5.76%
jan 1, 2010
68.731
-0.01
-0.01%
jan 1, 2011
69.376
+0.645
0.94%
jan 1, 2012
67.353
-2.023
-2.92%
jan 1, 2013
66.908
-0.445
-0.66%
jan 1, 2014
66.573
-0.335
-0.5%
jan 1, 2015
66.75
+0.177
0.27%
jan 1, 2016
66.29
-0.46
-0.69%
Ranking of countries by current statistics by years


Comments: