29
/
en
AIzaSyAYiBZKx7MnpbEhh9jyipgxe19OcubqV5w
April 1, 2024
122859
Dominican Republic
DOM
true
2
1
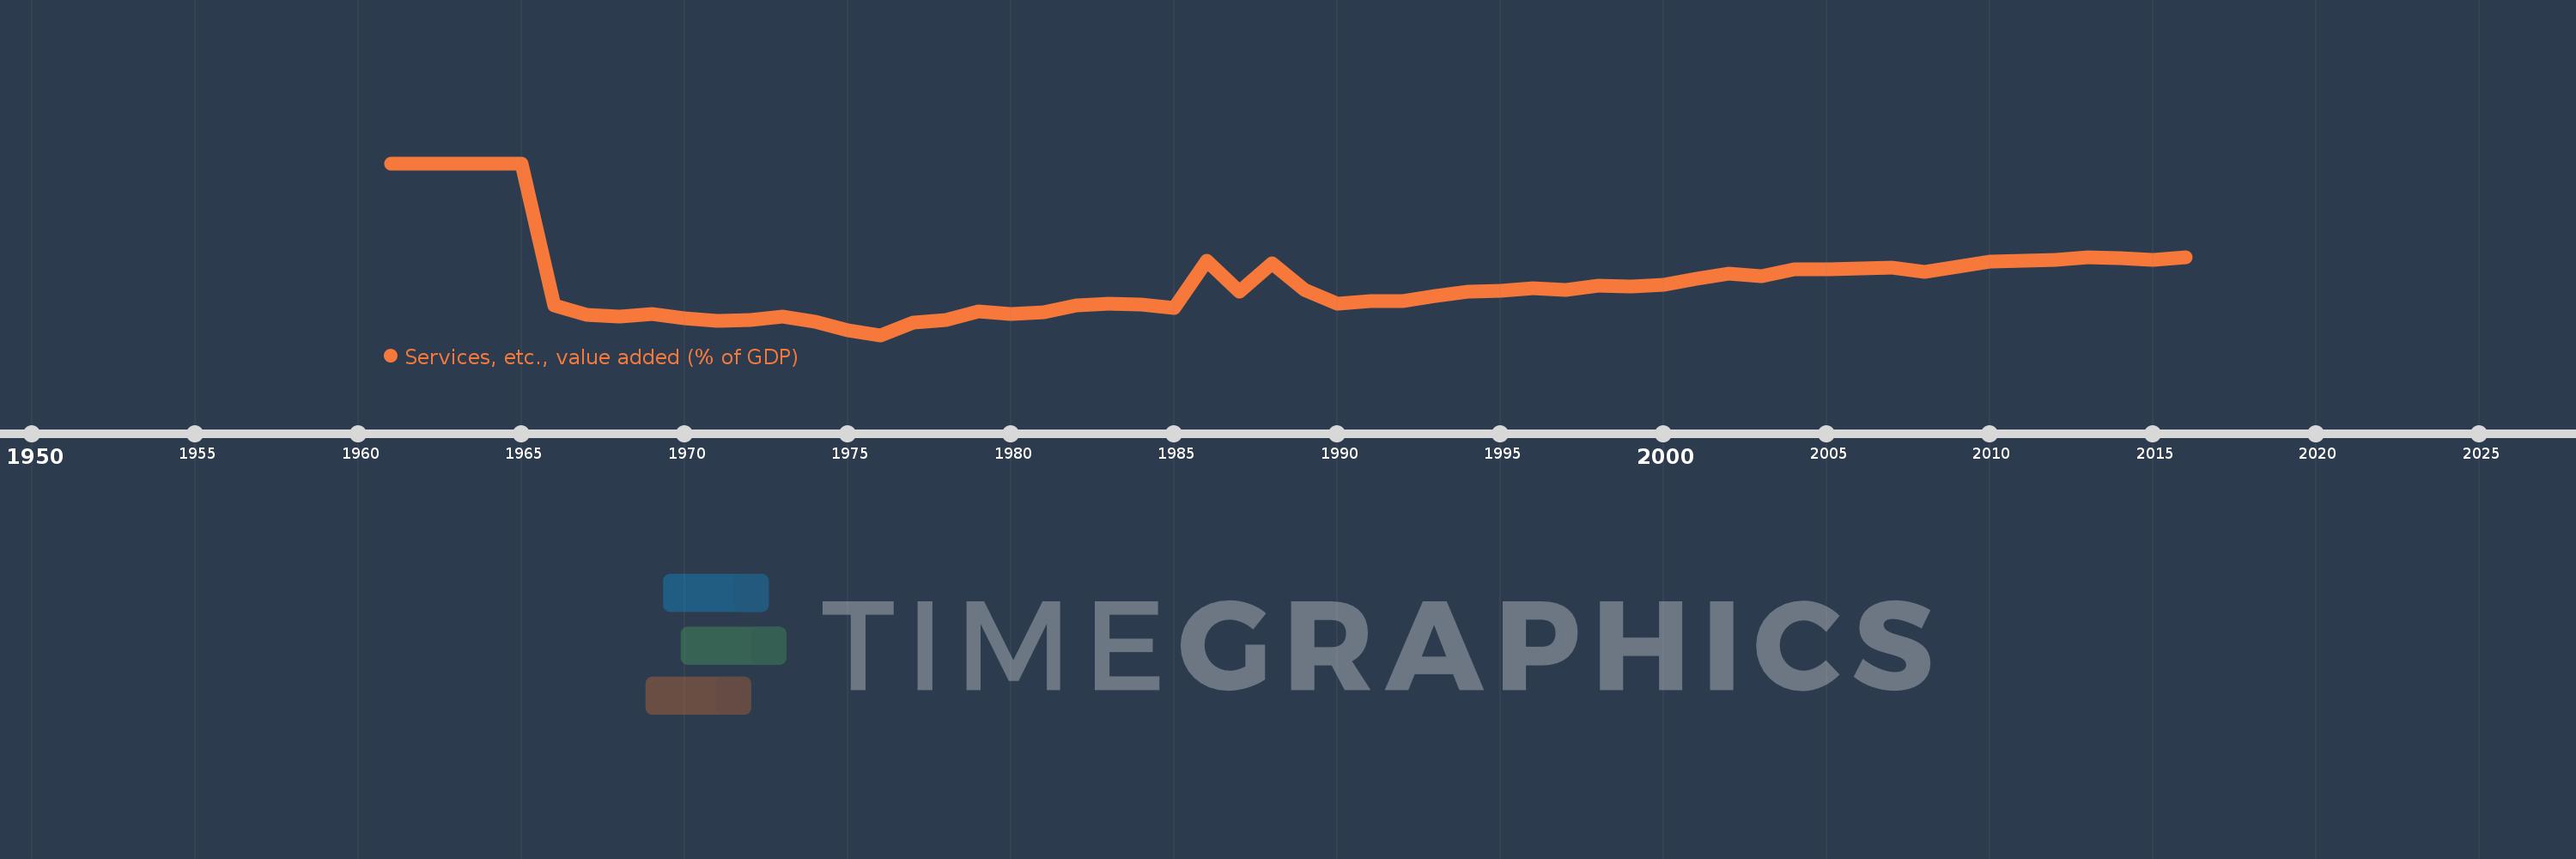
Services, etc., value added (% of GDP)
2016,2015,2014,2013,2012,2011,2010,2009,2008,2007,2006,2005,2004,2003,2002,2001,2000,1999,1998,1997,1996,1995,1994,1993,1992,1991,1990,1989,1988,1987,1986,1985,1984,1983,1982,1981,1980,1979,1978,1977,1976,1975,1974,1973,1972,1971,1970,1969,1968,1967,1966,1965,1964,1963,1962,1961
This statistics in other country:
AfghanistanAlbaniaAlgeriaAndorraAngolaAntigua and BarbudaArab WorldArgentinaArmeniaArubaAustraliaAustriaAzerbaijanBahamas, TheBahrainBangladeshBarbadosBelarusBelgiumBelizeBeninBermudaBhutanBoliviaBosnia and HerzegovinaBotswanaBrazilBrunei DarussalamBulgariaBurkina FasoBurundiCabo VerdeCambodiaCameroonCanadaCaribbean small statesCentral African RepublicCentral Europe and the BalticsChadChileChinaColombiaComorosCongo, Dem. Rep.Congo, Rep.Costa RicaCote d'IvoireCroatiaCubaCyprusCzech RepublicDenmarkDjiboutiDominicaDominican RepublicEarly-demographic dividendEast Asia & PacificEast Asia & Pacific (excluding high income)East Asia & Pacific (IDA & IBRD countries)EcuadorEgypt, Arab Rep.El SalvadorEquatorial GuineaEritreaEstoniaEthiopiaEuro areaEurope & Central AsiaEurope & Central Asia (excluding high income)Europe & Central Asia (IDA & IBRD countries)European UnionFaroe IslandsFijiFinlandFragile and conflict affected situationsFranceGabonGambia, TheGeorgiaGermanyGhanaGreeceGrenadaGuatemalaGuineaGuinea-BissauGuyanaHeavily indebted poor countries (HIPC)High incomeHondurasHong Kong SAR, ChinaHungaryIBRD onlyIcelandIDA & IBRD totalIDA blendIDA onlyIDA totalIndiaIndonesiaIran, Islamic Rep.IrelandItalyJamaicaJapanJordanKazakhstanKenyaKiribatiKorea, Rep.KosovoKuwaitKyrgyz RepublicLao PDRLate-demographic dividendLatin America & Caribbean Latin America & Caribbean (excluding high income)Latin America & the Caribbean (IDA & IBRD countries)LatviaLeast developed countries: UN classificationLebanonLesothoLibyaLithuaniaLow & middle incomeLow incomeLower middle incomeLuxembourgMacao SAR, ChinaMacedonia, FYRMadagascarMalawiMalaysiaMaldivesMaliMaltaMarshall IslandsMauritaniaMauritiusMexicoMicronesia, Fed. Sts.Middle East & North AfricaMiddle East & North Africa (excluding high income)Middle East & North Africa (IDA & IBRD countries)Middle incomeMoldovaMongoliaMontenegroMoroccoMozambiqueMyanmarNamibiaNepalNetherlandsNew CaledoniaNew ZealandNicaraguaNigerNigeriaNorth AmericaNorwayOECD membersOmanOther small statesPacific island small statesPakistanPalauPanamaPapua New GuineaParaguayPeruPhilippinesPolandPortugalPost-demographic dividendPre-demographic dividendPuerto RicoQatarRomaniaRussian FederationRwandaSao Tome and PrincipeSaudi ArabiaSenegalSerbiaSeychellesSierra LeoneSingaporeSlovak RepublicSloveniaSmall statesSolomon IslandsSomaliaSouth AfricaSouth AsiaSouth Asia (IDA & IBRD)SpainSri LankaSt. Kitts and NevisSt. LuciaSt. Vincent and the GrenadinesSub-Saharan Africa Sub-Saharan Africa (excluding high income)Sub-Saharan Africa (IDA & IBRD countries)SudanSurinameSwazilandSwedenSwitzerlandSyrian Arab RepublicTajikistanTanzaniaThailandTimor-LesteTogoTongaTrinidad and TobagoTunisiaTurkeyTurkmenistanTuvaluUgandaUkraineUnited KingdomUnited StatesUpper middle incomeUruguayUzbekistanVanuatuVenezuela, RBVietnamWest Bank and GazaWorldYemen, Rep.ZambiaZimbabwe Timeline:
This timeline shows a graph from 1961 to 2016 of Dominican Republic. No data until 1960. Number of actual observations by date: 56.
Source name:
World Development Indicators
Source organization:
World Bank national accounts data, and OECD National Accounts data files.
Categories, topics:
Economy & Growth
Last updated:
apr 23, 2017
Indicators value changes by year
Minimum:
39.653
jan 1, 1976
At the date of observation
Value
Absolute change
Change from previous value
jan 1, 1961
100.0
+100.0
0.0%
jan 1, 1962
100.0
0.0
0.0%
jan 1, 1963
100.0
0.0
0.0%
jan 1, 1964
100.0
0.0
0.0%
jan 1, 1965
100.0
0.0
0.0%
jan 1, 1966
50.087
-49.913
-49.91%
jan 1, 1967
46.707
-3.38
-6.75%
jan 1, 1968
46.158
-0.549
-1.18%
jan 1, 1969
47.169
+1.011
2.19%
jan 1, 1970
45.419
-1.75
-3.71%
jan 1, 1971
44.65
-0.769
-1.69%
jan 1, 1972
44.801
+0.151
0.34%
jan 1, 1973
46.241
+1.439
3.21%
jan 1, 1974
44.284
-1.956
-4.23%
jan 1, 1975
41.424
-2.86
-6.46%
jan 1, 1976
39.653
-1.771
-4.27%
jan 1, 1977
44.153
+4.5
11.35%
jan 1, 1978
45.043
+0.89
2.01%
jan 1, 1979
48.083
+3.04
6.75%
jan 1, 1980
46.905
-1.178
-2.45%
jan 1, 1981
47.551
+0.646
1.38%
jan 1, 1982
50.074
+2.524
5.31%
jan 1, 1983
50.754
+0.68
1.36%
jan 1, 1984
50.447
-0.307
-0.6%
jan 1, 1985
49.242
-1.205
-2.39%
jan 1, 1986
65.607
+16.364
33.23%
jan 1, 1987
54.861
-10.745
-16.38%
jan 1, 1988
64.889
+10.028
18.28%
jan 1, 1989
55.598
-9.292
-14.32%
jan 1, 1990
50.705
-4.892
-8.8%
jan 1, 1991
51.531
+0.825
1.63%
jan 1, 1992
51.655
+0.124
0.24%
jan 1, 1993
53.436
+1.781
3.45%
jan 1, 1994
54.933
+1.497
2.8%
jan 1, 1995
55.292
+0.359
0.65%
jan 1, 1996
56.198
+0.906
1.64%
jan 1, 1997
55.644
-0.553
-0.98%
jan 1, 1998
56.953
+1.309
2.35%
jan 1, 1999
56.764
-0.189
-0.33%
jan 1, 2000
57.35
+0.586
1.03%
jan 1, 2001
59.27
+1.92
3.35%
jan 1, 2002
61.13
+1.859
3.14%
jan 1, 2003
60.467
-0.662
-1.08%
jan 1, 2004
62.765
+2.298
3.8%
jan 1, 2005
62.712
-0.053
-0.08%
jan 1, 2006
62.993
+0.281
0.45%
jan 1, 2007
63.324
+0.331
0.53%
jan 1, 2008
61.881
-1.444
-2.28%
jan 1, 2009
63.505
+1.625
2.63%
jan 1, 2010
65.562
+2.056
3.24%
jan 1, 2011
65.885
+0.323
0.49%
jan 1, 2012
66.184
+0.299
0.45%
jan 1, 2013
66.933
+0.749
1.13%
jan 1, 2014
66.525
-0.408
-0.61%
jan 1, 2015
66.078
-0.447
-0.67%
jan 1, 2016
66.91
+0.833
1.26%
Ranking of countries by current statistics by years


Comments: