29
/
en
AIzaSyAYiBZKx7MnpbEhh9jyipgxe19OcubqV5w
April 1, 2024
43882
Latin America & the Caribbean (IDA & IBRD countries)
TLA
false
2
1
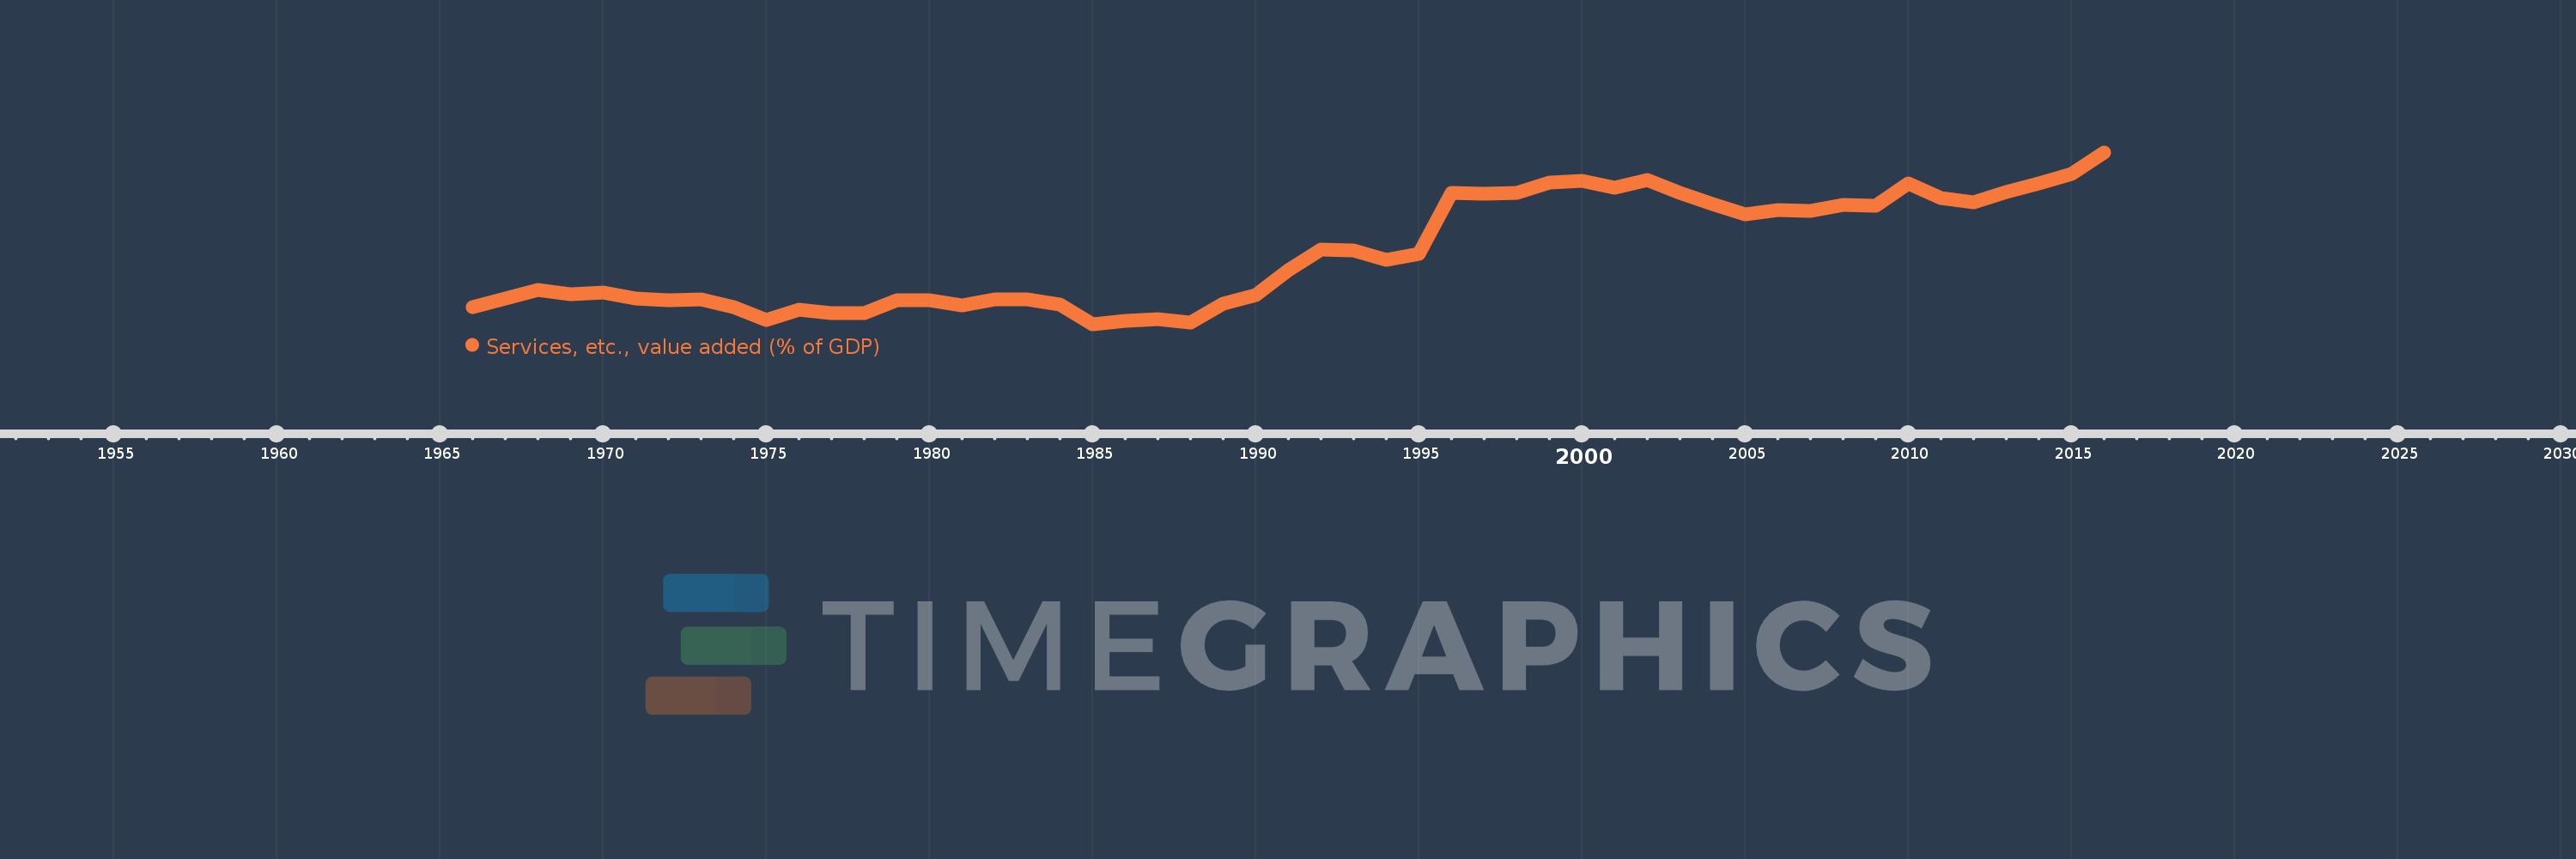
Services, etc., value added (% of GDP)
2016,2015,2014,2013,2012,2011,2010,2009,2008,2007,2006,2005,2004,2003,2002,2001,2000,1999,1998,1997,1996,1995,1994,1993,1992,1991,1990,1989,1988,1987,1986,1985,1984,1983,1982,1981,1980,1979,1978,1977,1976,1975,1974,1973,1972,1971,1970,1969,1968,1967,1966
This statistics in other country:
AfghanistanAlbaniaAlgeriaAndorraAngolaAntigua and BarbudaArab WorldArgentinaArmeniaArubaAustraliaAustriaAzerbaijanBahamas, TheBahrainBangladeshBarbadosBelarusBelgiumBelizeBeninBermudaBhutanBoliviaBosnia and HerzegovinaBotswanaBrazilBrunei DarussalamBulgariaBurkina FasoBurundiCabo VerdeCambodiaCameroonCanadaCaribbean small statesCentral African RepublicCentral Europe and the BalticsChadChileChinaColombiaComorosCongo, Dem. Rep.Congo, Rep.Costa RicaCote d'IvoireCroatiaCubaCyprusCzech RepublicDenmarkDjiboutiDominicaDominican RepublicEarly-demographic dividendEast Asia & PacificEast Asia & Pacific (excluding high income)East Asia & Pacific (IDA & IBRD countries)EcuadorEgypt, Arab Rep.El SalvadorEquatorial GuineaEritreaEstoniaEthiopiaEuro areaEurope & Central AsiaEurope & Central Asia (excluding high income)Europe & Central Asia (IDA & IBRD countries)European UnionFaroe IslandsFijiFinlandFragile and conflict affected situationsFranceGabonGambia, TheGeorgiaGermanyGhanaGreeceGrenadaGuatemalaGuineaGuinea-BissauGuyanaHeavily indebted poor countries (HIPC)High incomeHondurasHong Kong SAR, ChinaHungaryIBRD onlyIcelandIDA & IBRD totalIDA blendIDA onlyIDA totalIndiaIndonesiaIran, Islamic Rep.IrelandItalyJamaicaJapanJordanKazakhstanKenyaKiribatiKorea, Rep.KosovoKuwaitKyrgyz RepublicLao PDRLate-demographic dividendLatin America & Caribbean Latin America & Caribbean (excluding high income)Latin America & the Caribbean (IDA & IBRD countries)LatviaLeast developed countries: UN classificationLebanonLesothoLibyaLithuaniaLow & middle incomeLow incomeLower middle incomeLuxembourgMacao SAR, ChinaMacedonia, FYRMadagascarMalawiMalaysiaMaldivesMaliMaltaMarshall IslandsMauritaniaMauritiusMexicoMicronesia, Fed. Sts.Middle East & North AfricaMiddle East & North Africa (excluding high income)Middle East & North Africa (IDA & IBRD countries)Middle incomeMoldovaMongoliaMontenegroMoroccoMozambiqueMyanmarNamibiaNepalNetherlandsNew CaledoniaNew ZealandNicaraguaNigerNigeriaNorth AmericaNorwayOECD membersOmanOther small statesPacific island small statesPakistanPalauPanamaPapua New GuineaParaguayPeruPhilippinesPolandPortugalPost-demographic dividendPre-demographic dividendPuerto RicoQatarRomaniaRussian FederationRwandaSao Tome and PrincipeSaudi ArabiaSenegalSerbiaSeychellesSierra LeoneSingaporeSlovak RepublicSloveniaSmall statesSolomon IslandsSomaliaSouth AfricaSouth AsiaSouth Asia (IDA & IBRD)SpainSri LankaSt. Kitts and NevisSt. LuciaSt. Vincent and the GrenadinesSub-Saharan Africa Sub-Saharan Africa (excluding high income)Sub-Saharan Africa (IDA & IBRD countries)SudanSurinameSwazilandSwedenSwitzerlandSyrian Arab RepublicTajikistanTanzaniaThailandTimor-LesteTogoTongaTrinidad and TobagoTunisiaTurkeyTurkmenistanTuvaluUgandaUkraineUnited KingdomUnited StatesUpper middle incomeUruguayUzbekistanVanuatuVenezuela, RBVietnamWest Bank and GazaWorldYemen, Rep.ZambiaZimbabwe Timeline:
This timeline shows a graph from 1966 to 2016 of Latin America & the Caribbean (IDA & IBRD countries). No data until 1965. Number of actual observations by date: 51.
Source name:
World Development Indicators
Source organization:
World Bank national accounts data, and OECD National Accounts data files.
Categories, topics:
Economy & Growth
Last updated:
apr 23, 2017
Indicators value changes by year
Minimum:
47.973
jan 1, 1985
Maximum:
67.088
jan 1, 2016
At the date of observation
Value
Absolute change
Change from previous value
jan 1, 1966
49.851
+49.851
0.0%
jan 1, 1967
50.878
+1.026
2.06%
jan 1, 1968
51.798
+0.921
1.81%
jan 1, 1969
51.314
-0.485
-0.94%
jan 1, 1970
51.495
+0.181
0.35%
jan 1, 1971
50.867
-0.628
-1.22%
jan 1, 1972
50.621
-0.245
-0.48%
jan 1, 1973
50.756
+0.135
0.27%
jan 1, 1974
49.851
-0.906
-1.78%
jan 1, 1975
48.406
-1.444
-2.9%
jan 1, 1976
49.601
+1.195
2.47%
jan 1, 1977
49.253
-0.348
-0.7%
jan 1, 1978
49.247
-0.007
-0.01%
jan 1, 1979
50.604
+1.357
2.76%
jan 1, 1980
50.679
+0.076
0.15%
jan 1, 1981
50.05
-0.63
-1.24%
jan 1, 1982
50.751
+0.702
1.4%
jan 1, 1983
50.779
+0.028
0.06%
jan 1, 1984
50.15
-0.629
-1.24%
jan 1, 1985
47.973
-2.177
-4.34%
jan 1, 1986
48.309
+0.336
0.7%
jan 1, 1987
48.568
+0.259
0.54%
jan 1, 1988
48.134
-0.434
-0.89%
jan 1, 1989
50.26
+2.125
4.42%
jan 1, 1990
51.211
+0.952
1.89%
jan 1, 1991
53.942
+2.73
5.33%
jan 1, 1992
56.233
+2.291
4.25%
jan 1, 1993
56.137
-0.096
-0.17%
jan 1, 1994
55.177
-0.961
-1.71%
jan 1, 1995
55.795
+0.618
1.12%
jan 1, 1996
62.605
+6.811
12.21%
jan 1, 1997
62.533
-0.072
-0.11%
jan 1, 1998
62.63
+0.096
0.15%
jan 1, 1999
63.761
+1.132
1.81%
jan 1, 2000
63.906
+0.144
0.23%
jan 1, 2001
63.194
-0.712
-1.11%
jan 1, 2002
64.045
+0.851
1.35%
jan 1, 2003
62.547
-1.498
-2.34%
jan 1, 2004
61.298
-1.25
-2.0%
jan 1, 2005
60.201
-1.097
-1.79%
jan 1, 2006
60.653
+0.452
0.75%
jan 1, 2007
60.598
-0.055
-0.09%
jan 1, 2008
61.235
+0.637
1.05%
jan 1, 2009
61.114
-0.121
-0.2%
jan 1, 2010
63.605
+2.491
4.08%
jan 1, 2011
61.995
-1.61
-2.53%
jan 1, 2012
61.525
-0.469
-0.76%
jan 1, 2013
62.703
+1.177
1.91%
jan 1, 2014
63.655
+0.952
1.52%
jan 1, 2015
64.647
+0.992
1.56%
jan 1, 2016
67.088
+2.441
3.78%
Ranking of countries by current statistics by years


Comments: