29
/
en
AIzaSyAYiBZKx7MnpbEhh9jyipgxe19OcubqV5w
April 1, 2024
212379
Niger
NER
true
2
1
Services, etc., value added (% of GDP)
2016,2015,2014,2013,2012,2011,2010,2009,2008,2007,2006,2005,2004,2003,2002,2001,2000,1999,1998,1997,1996,1995,1994,1993,1992,1991,1990,1989,1988,1987,1986,1985,1984,1983,1982,1981,1980,1979,1978,1977,1976,1975,1974,1973,1972,1971,1970,1969,1968,1967,1966,1965,1964,1963,1962,1961
This statistics in other country:
AfghanistanAlbaniaAlgeriaAndorraAngolaAntigua and BarbudaArab WorldArgentinaArmeniaArubaAustraliaAustriaAzerbaijanBahamas, TheBahrainBangladeshBarbadosBelarusBelgiumBelizeBeninBermudaBhutanBoliviaBosnia and HerzegovinaBotswanaBrazilBrunei DarussalamBulgariaBurkina FasoBurundiCabo VerdeCambodiaCameroonCanadaCaribbean small statesCentral African RepublicCentral Europe and the BalticsChadChileChinaColombiaComorosCongo, Dem. Rep.Congo, Rep.Costa RicaCote d'IvoireCroatiaCubaCyprusCzech RepublicDenmarkDjiboutiDominicaDominican RepublicEarly-demographic dividendEast Asia & PacificEast Asia & Pacific (excluding high income)East Asia & Pacific (IDA & IBRD countries)EcuadorEgypt, Arab Rep.El SalvadorEquatorial GuineaEritreaEstoniaEthiopiaEuro areaEurope & Central AsiaEurope & Central Asia (excluding high income)Europe & Central Asia (IDA & IBRD countries)European UnionFaroe IslandsFijiFinlandFragile and conflict affected situationsFranceGabonGambia, TheGeorgiaGermanyGhanaGreeceGrenadaGuatemalaGuineaGuinea-BissauGuyanaHeavily indebted poor countries (HIPC)High incomeHondurasHong Kong SAR, ChinaHungaryIBRD onlyIcelandIDA & IBRD totalIDA blendIDA onlyIDA totalIndiaIndonesiaIran, Islamic Rep.IrelandItalyJamaicaJapanJordanKazakhstanKenyaKiribatiKorea, Rep.KosovoKuwaitKyrgyz RepublicLao PDRLate-demographic dividendLatin America & Caribbean Latin America & Caribbean (excluding high income)Latin America & the Caribbean (IDA & IBRD countries)LatviaLeast developed countries: UN classificationLebanonLesothoLibyaLithuaniaLow & middle incomeLow incomeLower middle incomeLuxembourgMacao SAR, ChinaMacedonia, FYRMadagascarMalawiMalaysiaMaldivesMaliMaltaMarshall IslandsMauritaniaMauritiusMexicoMicronesia, Fed. Sts.Middle East & North AfricaMiddle East & North Africa (excluding high income)Middle East & North Africa (IDA & IBRD countries)Middle incomeMoldovaMongoliaMontenegroMoroccoMozambiqueMyanmarNamibiaNepalNetherlandsNew CaledoniaNew ZealandNicaraguaNigerNigeriaNorth AmericaNorwayOECD membersOmanOther small statesPacific island small statesPakistanPalauPanamaPapua New GuineaParaguayPeruPhilippinesPolandPortugalPost-demographic dividendPre-demographic dividendPuerto RicoQatarRomaniaRussian FederationRwandaSao Tome and PrincipeSaudi ArabiaSenegalSerbiaSeychellesSierra LeoneSingaporeSlovak RepublicSloveniaSmall statesSolomon IslandsSomaliaSouth AfricaSouth AsiaSouth Asia (IDA & IBRD)SpainSri LankaSt. Kitts and NevisSt. LuciaSt. Vincent and the GrenadinesSub-Saharan Africa Sub-Saharan Africa (excluding high income)Sub-Saharan Africa (IDA & IBRD countries)SudanSurinameSwazilandSwedenSwitzerlandSyrian Arab RepublicTajikistanTanzaniaThailandTimor-LesteTogoTongaTrinidad and TobagoTunisiaTurkeyTurkmenistanTuvaluUgandaUkraineUnited KingdomUnited StatesUpper middle incomeUruguayUzbekistanVanuatuVenezuela, RBVietnamWest Bank and GazaWorldYemen, Rep.ZambiaZimbabwe Timeline:
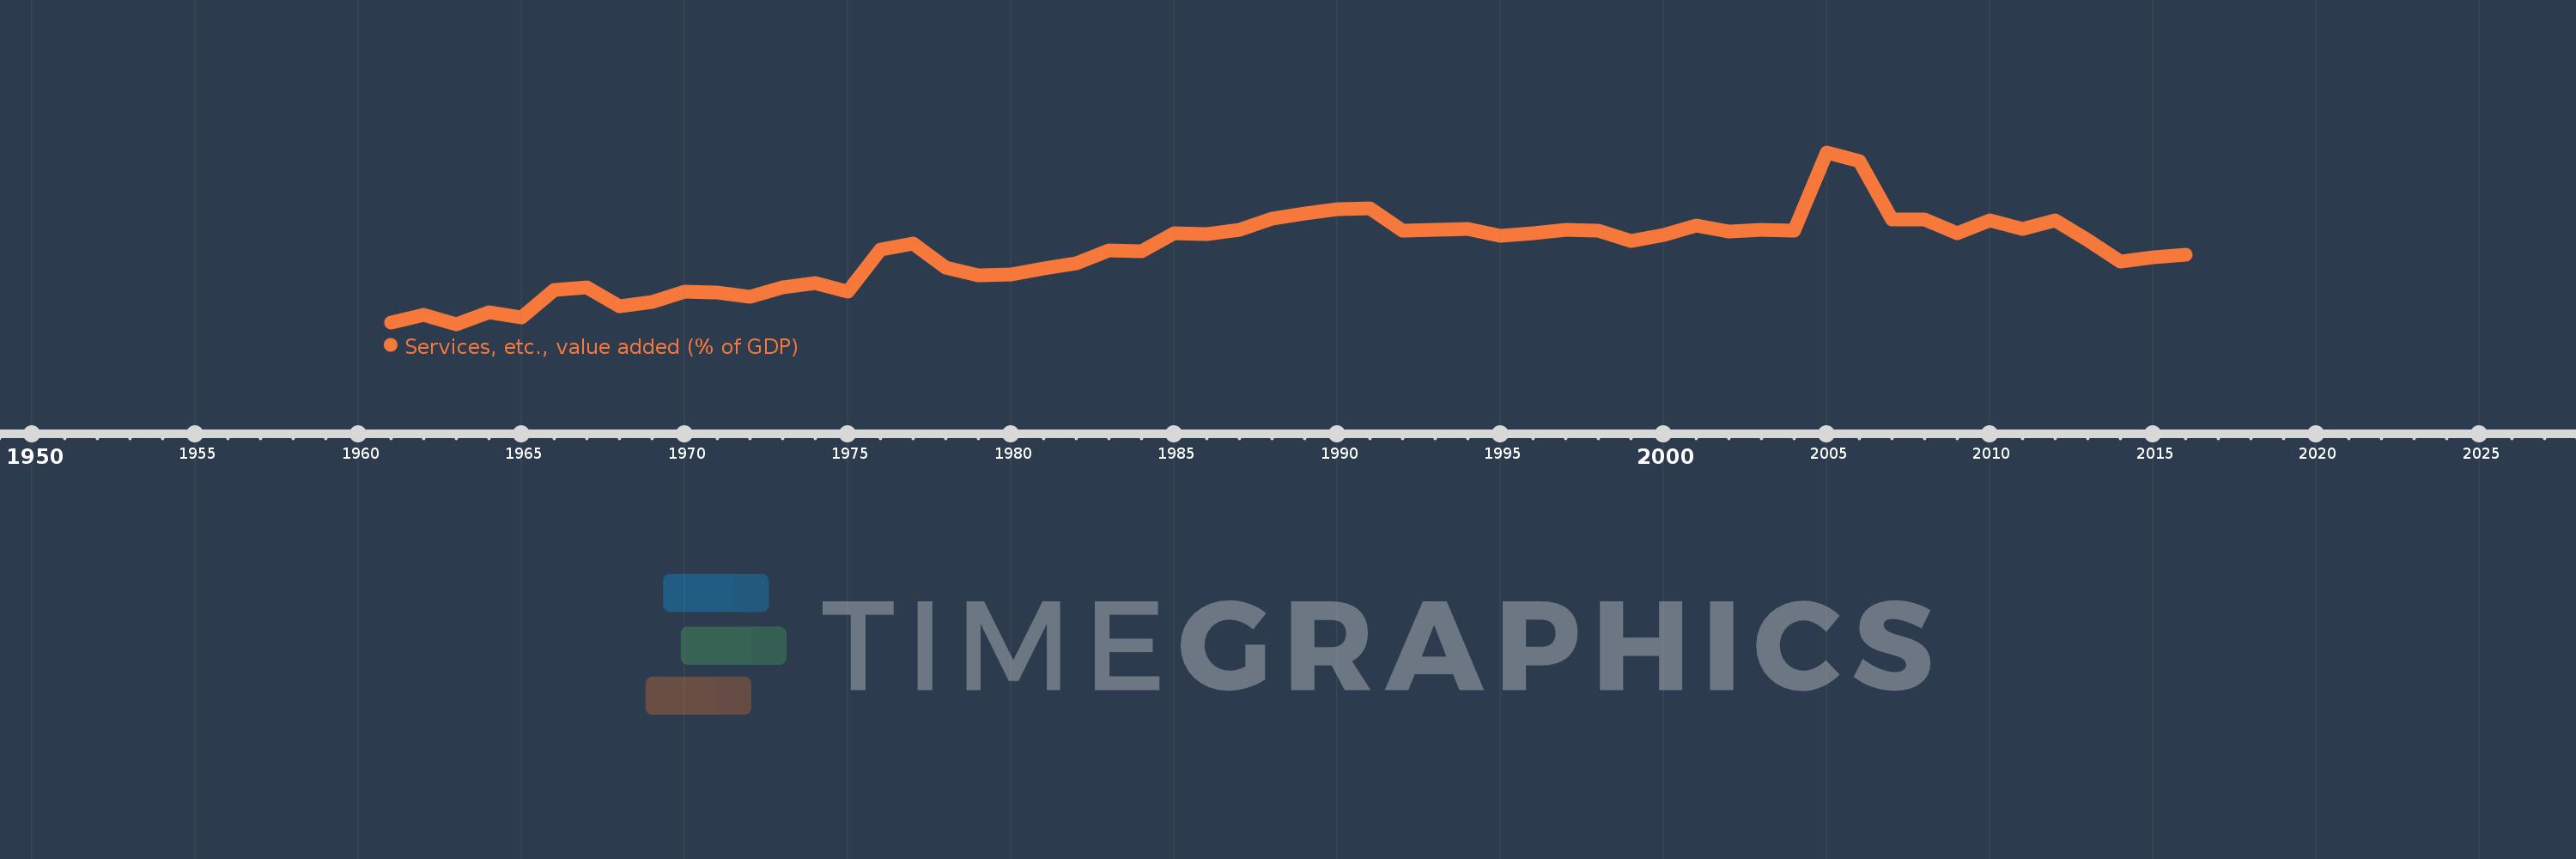
This timeline shows a graph from 1961 to 2016 of Niger. No data until 1960. Number of actual observations by date: 56.
Source name:
World Development Indicators
Source organization:
World Bank national accounts data, and OECD National Accounts data files.
Categories, topics:
Economy & Growth
Last updated:
apr 23, 2017
Indicators value changes by year
Minimum:
20.483
jan 1, 1963
Maximum:
62.117
jan 1, 2005
At the date of observation
Value
Absolute change
Change from previous value
jan 1, 1961
20.79
+20.79
0.0%
jan 1, 1962
22.666
+1.876
9.03%
jan 1, 1963
20.483
-2.184
-9.63%
jan 1, 1964
23.438
+2.956
14.43%
jan 1, 1965
22.077
-1.362
-5.81%
jan 1, 1966
28.824
+6.748
30.56%
jan 1, 1967
29.405
+0.58
2.01%
jan 1, 1968
24.86
-4.545
-15.46%
jan 1, 1969
25.977
+1.117
4.49%
jan 1, 1970
28.336
+2.359
9.08%
jan 1, 1971
28.183
-0.153
-0.54%
jan 1, 1972
27.142
-1.042
-3.7%
jan 1, 1973
29.438
+2.296
8.46%
jan 1, 1974
30.351
+0.913
3.1%
jan 1, 1975
28.47
-1.881
-6.2%
jan 1, 1976
38.675
+10.205
35.84%
jan 1, 1977
40.093
+1.418
3.67%
jan 1, 1978
34.225
-5.868
-14.63%
jan 1, 1979
32.362
-1.863
-5.44%
jan 1, 1980
32.575
+0.212
0.66%
jan 1, 1981
34.0
+1.425
4.37%
jan 1, 1982
35.192
+1.192
3.51%
jan 1, 1983
38.446
+3.254
9.25%
jan 1, 1984
38.175
-0.272
-0.71%
jan 1, 1985
42.631
+4.456
11.67%
jan 1, 1986
42.336
-0.295
-0.69%
jan 1, 1987
43.433
+1.097
2.59%
jan 1, 1988
46.089
+2.655
6.11%
jan 1, 1989
47.291
+1.202
2.61%
jan 1, 1990
48.382
+1.091
2.31%
jan 1, 1991
48.593
+0.211
0.44%
jan 1, 1992
43.189
-5.404
-11.12%
jan 1, 1993
43.38
+0.191
0.44%
jan 1, 1994
43.629
+0.249
0.57%
jan 1, 1995
41.906
-1.724
-3.95%
jan 1, 1996
42.544
+0.638
1.52%
jan 1, 1997
43.266
+0.722
1.7%
jan 1, 1998
43.215
-0.051
-0.12%
jan 1, 1999
40.662
-2.553
-5.91%
jan 1, 2000
42.113
+1.452
3.57%
jan 1, 2001
44.4
+2.287
5.43%
jan 1, 2002
43.001
-1.399
-3.15%
jan 1, 2003
43.443
+0.441
1.03%
jan 1, 2004
43.231
-0.211
-0.49%
jan 1, 2005
62.117
+18.886
43.69%
jan 1, 2006
59.912
-2.205
-3.55%
jan 1, 2007
45.855
-14.057
-23.46%
jan 1, 2008
45.851
-0.004
-0.01%
jan 1, 2009
42.563
-3.288
-7.17%
jan 1, 2010
45.734
+3.171
7.45%
jan 1, 2011
43.485
-2.249
-4.92%
jan 1, 2012
45.658
+2.173
5.0%
jan 1, 2013
40.849
-4.809
-10.53%
jan 1, 2014
35.697
-5.152
-12.61%
jan 1, 2015
36.608
+0.911
2.55%
jan 1, 2016
37.332
+0.724
1.98%
Ranking of countries by current statistics by years


Comments: