29
/
en
AIzaSyAYiBZKx7MnpbEhh9jyipgxe19OcubqV5w
April 1, 2024
38587
IDA blend
IDB
false
2
1
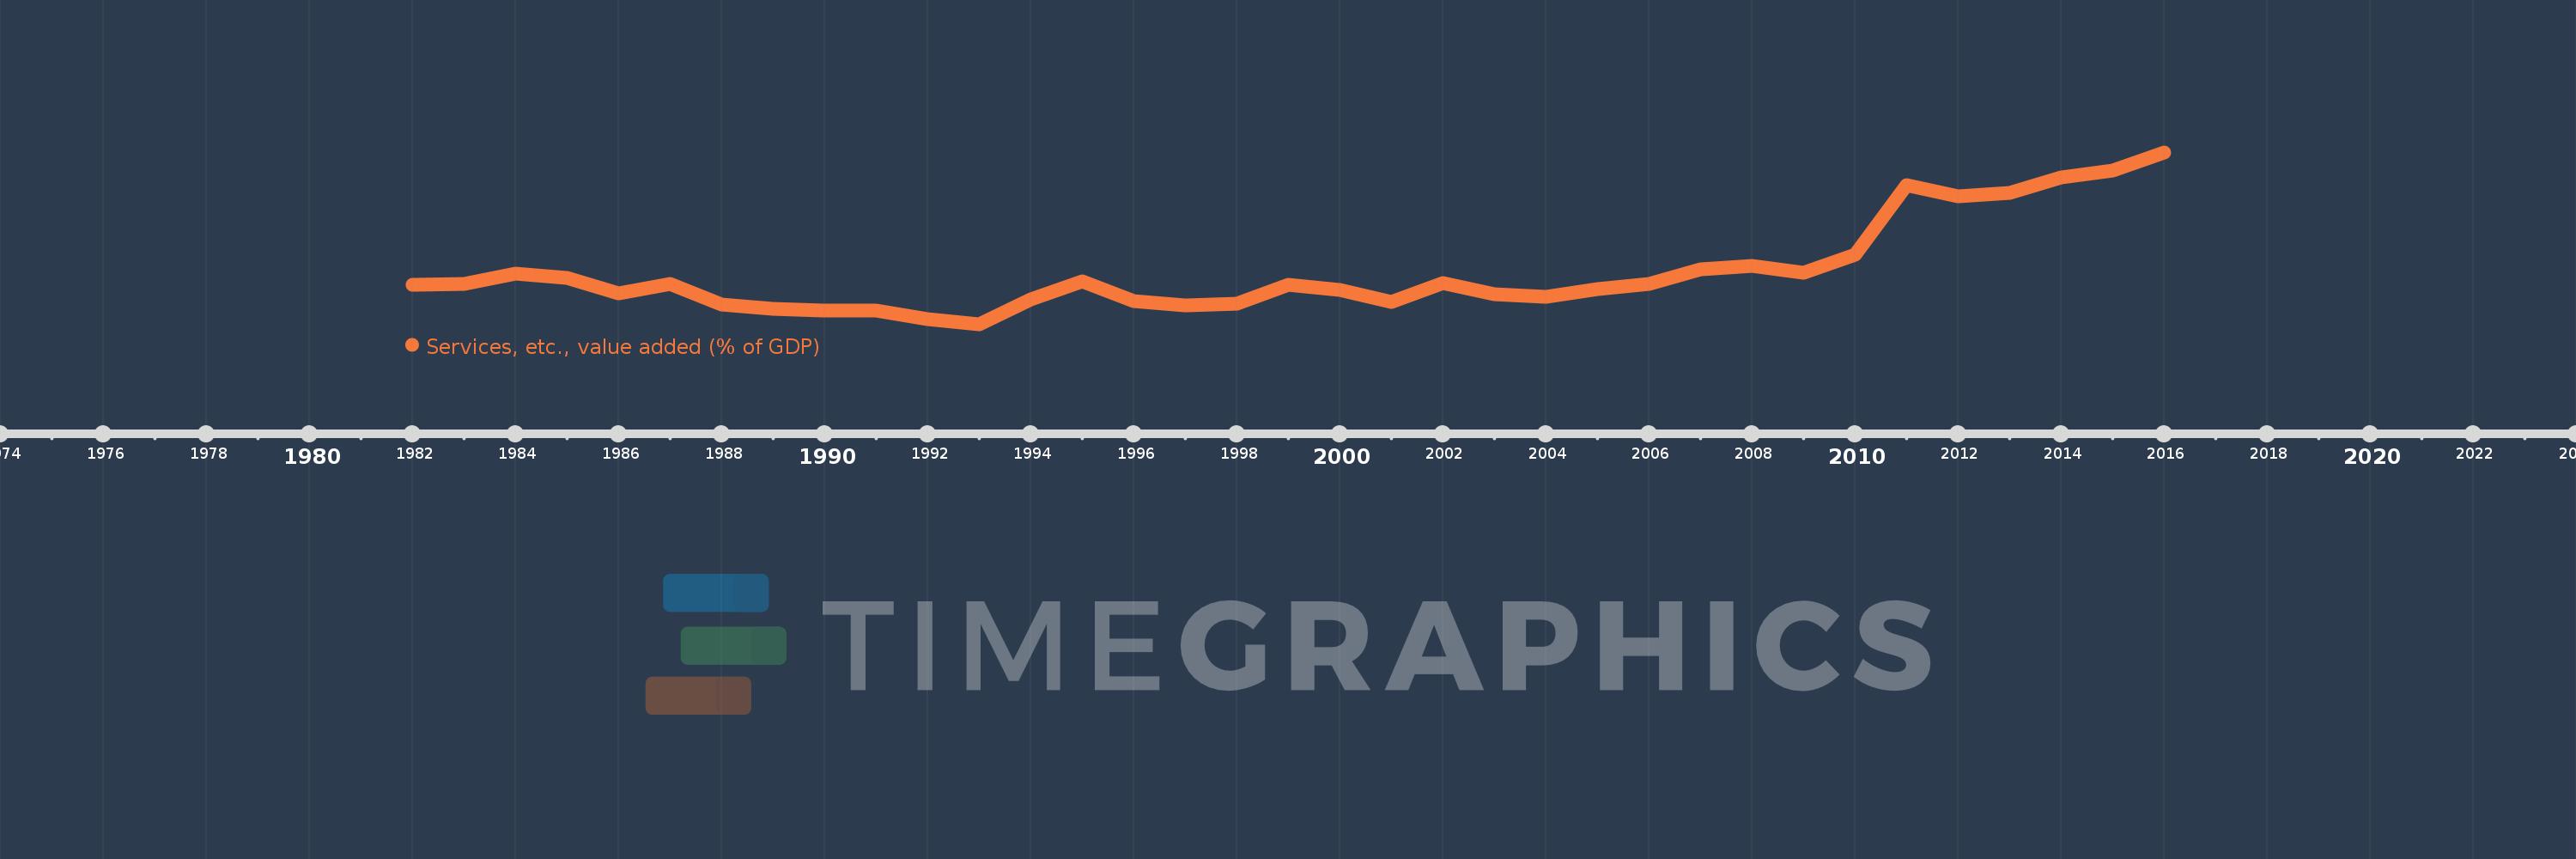
Services, etc., value added (% of GDP)
2016,2015,2014,2013,2012,2011,2010,2009,2008,2007,2006,2005,2004,2003,2002,2001,2000,1999,1998,1997,1996,1995,1994,1993,1992,1991,1990,1989,1988,1987,1986,1985,1984,1983,1982
This statistics in other country:
AfghanistanAlbaniaAlgeriaAndorraAngolaAntigua and BarbudaArab WorldArgentinaArmeniaArubaAustraliaAustriaAzerbaijanBahamas, TheBahrainBangladeshBarbadosBelarusBelgiumBelizeBeninBermudaBhutanBoliviaBosnia and HerzegovinaBotswanaBrazilBrunei DarussalamBulgariaBurkina FasoBurundiCabo VerdeCambodiaCameroonCanadaCaribbean small statesCentral African RepublicCentral Europe and the BalticsChadChileChinaColombiaComorosCongo, Dem. Rep.Congo, Rep.Costa RicaCote d'IvoireCroatiaCubaCyprusCzech RepublicDenmarkDjiboutiDominicaDominican RepublicEarly-demographic dividendEast Asia & PacificEast Asia & Pacific (excluding high income)East Asia & Pacific (IDA & IBRD countries)EcuadorEgypt, Arab Rep.El SalvadorEquatorial GuineaEritreaEstoniaEthiopiaEuro areaEurope & Central AsiaEurope & Central Asia (excluding high income)Europe & Central Asia (IDA & IBRD countries)European UnionFaroe IslandsFijiFinlandFragile and conflict affected situationsFranceGabonGambia, TheGeorgiaGermanyGhanaGreeceGrenadaGuatemalaGuineaGuinea-BissauGuyanaHeavily indebted poor countries (HIPC)High incomeHondurasHong Kong SAR, ChinaHungaryIBRD onlyIcelandIDA & IBRD totalIDA blendIDA onlyIDA totalIndiaIndonesiaIran, Islamic Rep.IrelandItalyJamaicaJapanJordanKazakhstanKenyaKiribatiKorea, Rep.KosovoKuwaitKyrgyz RepublicLao PDRLate-demographic dividendLatin America & Caribbean Latin America & Caribbean (excluding high income)Latin America & the Caribbean (IDA & IBRD countries)LatviaLeast developed countries: UN classificationLebanonLesothoLibyaLithuaniaLow & middle incomeLow incomeLower middle incomeLuxembourgMacao SAR, ChinaMacedonia, FYRMadagascarMalawiMalaysiaMaldivesMaliMaltaMarshall IslandsMauritaniaMauritiusMexicoMicronesia, Fed. Sts.Middle East & North AfricaMiddle East & North Africa (excluding high income)Middle East & North Africa (IDA & IBRD countries)Middle incomeMoldovaMongoliaMontenegroMoroccoMozambiqueMyanmarNamibiaNepalNetherlandsNew CaledoniaNew ZealandNicaraguaNigerNigeriaNorth AmericaNorwayOECD membersOmanOther small statesPacific island small statesPakistanPalauPanamaPapua New GuineaParaguayPeruPhilippinesPolandPortugalPost-demographic dividendPre-demographic dividendPuerto RicoQatarRomaniaRussian FederationRwandaSao Tome and PrincipeSaudi ArabiaSenegalSerbiaSeychellesSierra LeoneSingaporeSlovak RepublicSloveniaSmall statesSolomon IslandsSomaliaSouth AfricaSouth AsiaSouth Asia (IDA & IBRD)SpainSri LankaSt. Kitts and NevisSt. LuciaSt. Vincent and the GrenadinesSub-Saharan Africa Sub-Saharan Africa (excluding high income)Sub-Saharan Africa (IDA & IBRD countries)SudanSurinameSwazilandSwedenSwitzerlandSyrian Arab RepublicTajikistanTanzaniaThailandTimor-LesteTogoTongaTrinidad and TobagoTunisiaTurkeyTurkmenistanTuvaluUgandaUkraineUnited KingdomUnited StatesUpper middle incomeUruguayUzbekistanVanuatuVenezuela, RBVietnamWest Bank and GazaWorldYemen, Rep.ZambiaZimbabwe Timeline:
This timeline shows a graph from 1982 to 2016 of IDA blend. No data until 1981. Number of actual observations by date: 35.
Source name:
World Development Indicators
Source organization:
World Bank national accounts data, and OECD National Accounts data files.
Categories, topics:
Economy & Growth
Last updated:
apr 23, 2017
Indicators value changes by year
Minimum:
35.188
jan 1, 1993
Maximum:
53.598
jan 1, 2016
At the date of observation
Value
Absolute change
Change from previous value
jan 1, 1982
39.428
+39.428
0.0%
jan 1, 1983
39.517
+0.089
0.23%
jan 1, 1984
40.618
+1.1
2.78%
jan 1, 1985
40.12
-0.497
-1.22%
jan 1, 1986
38.474
-1.647
-4.1%
jan 1, 1987
39.528
+1.054
2.74%
jan 1, 1988
37.328
-2.2
-5.56%
jan 1, 1989
36.803
-0.526
-1.41%
jan 1, 1990
36.682
-0.121
-0.33%
jan 1, 1991
36.686
+0.004
0.01%
jan 1, 1992
35.747
-0.938
-2.56%
jan 1, 1993
35.188
-0.559
-1.56%
jan 1, 1994
37.834
+2.646
7.52%
jan 1, 1995
39.765
+1.931
5.1%
jan 1, 1996
37.679
-2.086
-5.25%
jan 1, 1997
37.161
-0.518
-1.37%
jan 1, 1998
37.353
+0.192
0.52%
jan 1, 1999
39.377
+2.024
5.42%
jan 1, 2000
38.82
-0.557
-1.41%
jan 1, 2001
37.583
-1.238
-3.19%
jan 1, 2002
39.58
+1.997
5.31%
jan 1, 2003
38.357
-1.223
-3.09%
jan 1, 2004
38.167
-0.19
-0.5%
jan 1, 2005
38.927
+0.76
1.99%
jan 1, 2006
39.503
+0.576
1.48%
jan 1, 2007
41.07
+1.567
3.97%
jan 1, 2008
41.413
+0.343
0.83%
jan 1, 2009
40.74
-0.673
-1.62%
jan 1, 2010
42.601
+1.861
4.57%
jan 1, 2011
50.072
+7.471
17.54%
jan 1, 2012
48.859
-1.213
-2.42%
jan 1, 2013
49.277
+0.418
0.86%
jan 1, 2014
50.895
+1.618
3.28%
jan 1, 2015
51.659
+0.763
1.5%
jan 1, 2016
53.598
+1.939
3.75%
Ranking of countries by current statistics by years


Comments: