29
/
en
AIzaSyAYiBZKx7MnpbEhh9jyipgxe19OcubqV5w
April 1, 2024
151103
Honduras
HND
true
2
1
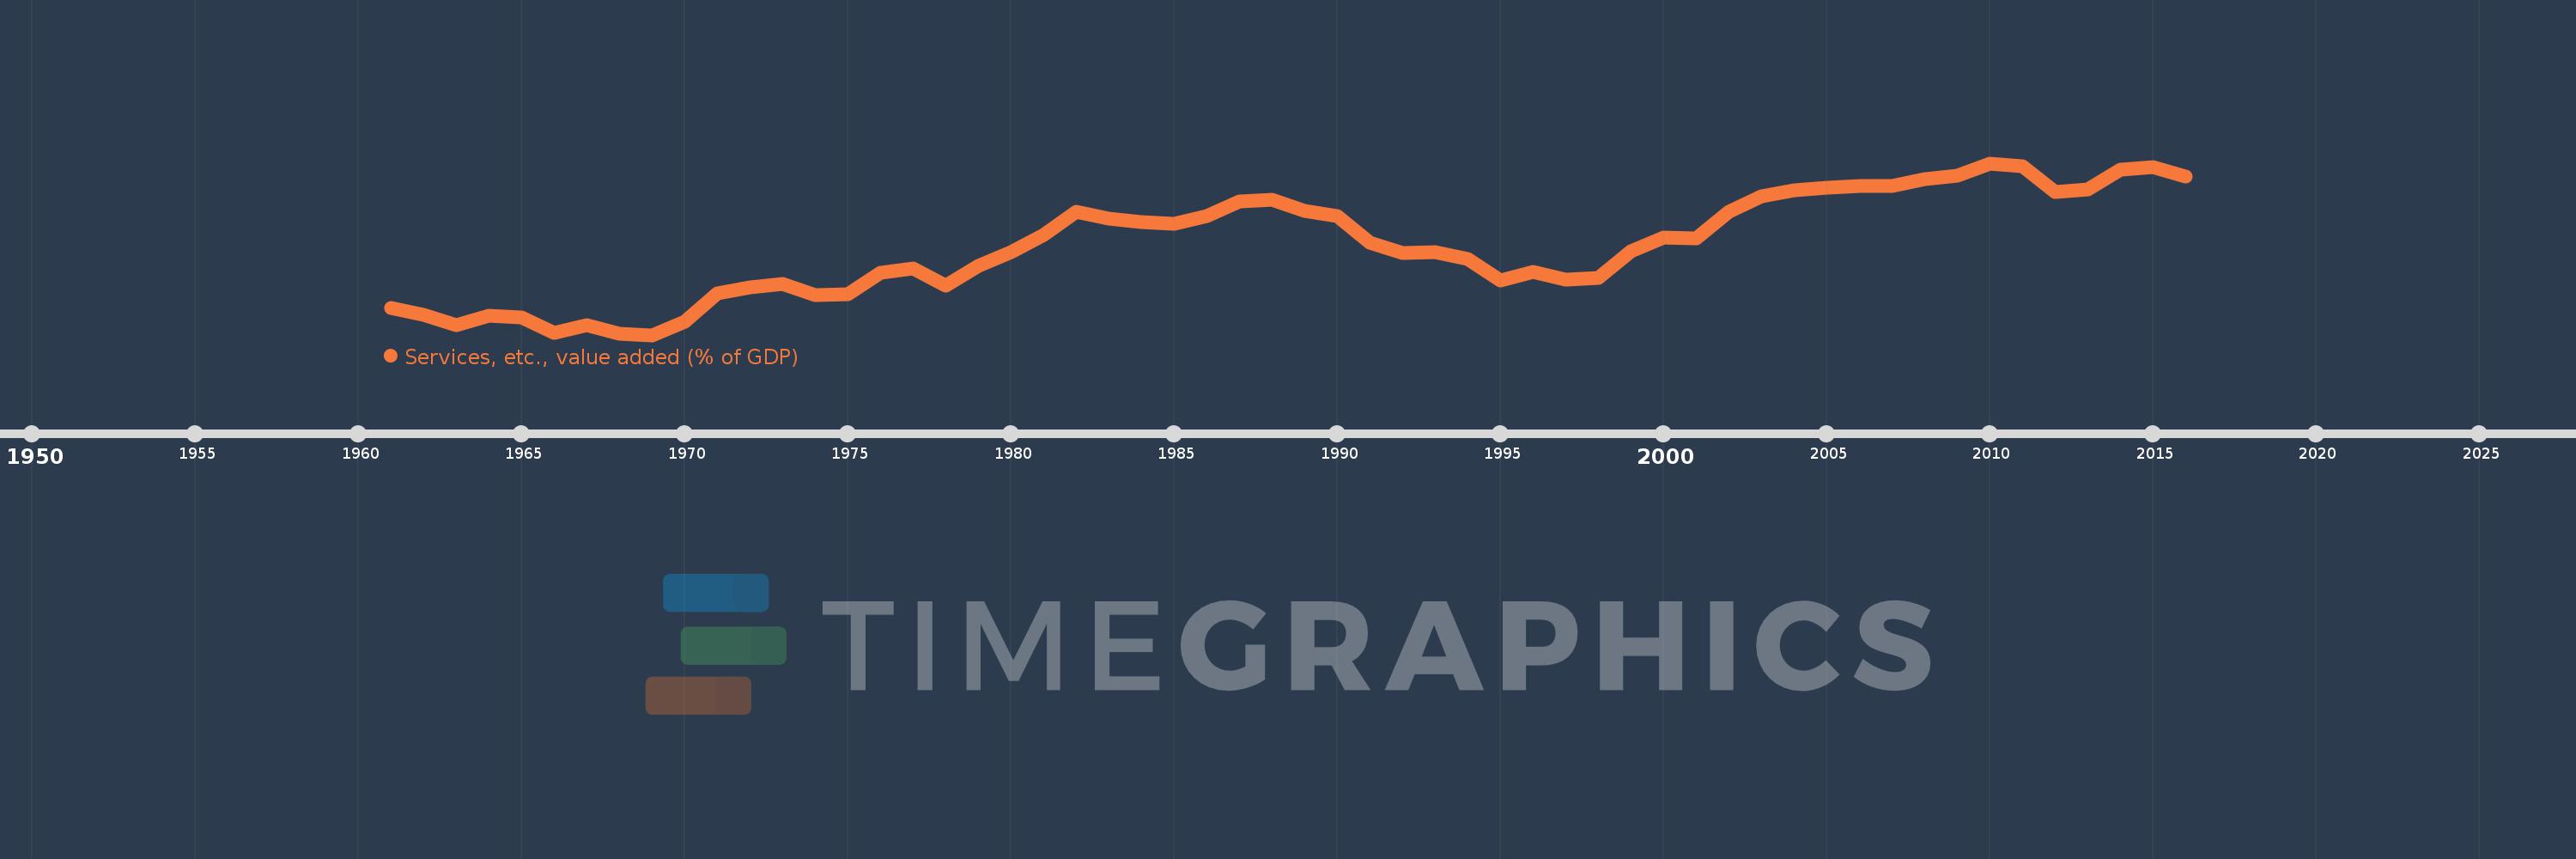
Services, etc., value added (% of GDP)
2016,2015,2014,2013,2012,2011,2010,2009,2008,2007,2006,2005,2004,2003,2002,2001,2000,1999,1998,1997,1996,1995,1994,1993,1992,1991,1990,1989,1988,1987,1986,1985,1984,1983,1982,1981,1980,1979,1978,1977,1976,1975,1974,1973,1972,1971,1970,1969,1968,1967,1966,1965,1964,1963,1962,1961
This statistics in other country:
AfghanistanAlbaniaAlgeriaAndorraAngolaAntigua and BarbudaArab WorldArgentinaArmeniaArubaAustraliaAustriaAzerbaijanBahamas, TheBahrainBangladeshBarbadosBelarusBelgiumBelizeBeninBermudaBhutanBoliviaBosnia and HerzegovinaBotswanaBrazilBrunei DarussalamBulgariaBurkina FasoBurundiCabo VerdeCambodiaCameroonCanadaCaribbean small statesCentral African RepublicCentral Europe and the BalticsChadChileChinaColombiaComorosCongo, Dem. Rep.Congo, Rep.Costa RicaCote d'IvoireCroatiaCubaCyprusCzech RepublicDenmarkDjiboutiDominicaDominican RepublicEarly-demographic dividendEast Asia & PacificEast Asia & Pacific (excluding high income)East Asia & Pacific (IDA & IBRD countries)EcuadorEgypt, Arab Rep.El SalvadorEquatorial GuineaEritreaEstoniaEthiopiaEuro areaEurope & Central AsiaEurope & Central Asia (excluding high income)Europe & Central Asia (IDA & IBRD countries)European UnionFaroe IslandsFijiFinlandFragile and conflict affected situationsFranceGabonGambia, TheGeorgiaGermanyGhanaGreeceGrenadaGuatemalaGuineaGuinea-BissauGuyanaHeavily indebted poor countries (HIPC)High incomeHondurasHong Kong SAR, ChinaHungaryIBRD onlyIcelandIDA & IBRD totalIDA blendIDA onlyIDA totalIndiaIndonesiaIran, Islamic Rep.IrelandItalyJamaicaJapanJordanKazakhstanKenyaKiribatiKorea, Rep.KosovoKuwaitKyrgyz RepublicLao PDRLate-demographic dividendLatin America & Caribbean Latin America & Caribbean (excluding high income)Latin America & the Caribbean (IDA & IBRD countries)LatviaLeast developed countries: UN classificationLebanonLesothoLibyaLithuaniaLow & middle incomeLow incomeLower middle incomeLuxembourgMacao SAR, ChinaMacedonia, FYRMadagascarMalawiMalaysiaMaldivesMaliMaltaMarshall IslandsMauritaniaMauritiusMexicoMicronesia, Fed. Sts.Middle East & North AfricaMiddle East & North Africa (excluding high income)Middle East & North Africa (IDA & IBRD countries)Middle incomeMoldovaMongoliaMontenegroMoroccoMozambiqueMyanmarNamibiaNepalNetherlandsNew CaledoniaNew ZealandNicaraguaNigerNigeriaNorth AmericaNorwayOECD membersOmanOther small statesPacific island small statesPakistanPalauPanamaPapua New GuineaParaguayPeruPhilippinesPolandPortugalPost-demographic dividendPre-demographic dividendPuerto RicoQatarRomaniaRussian FederationRwandaSao Tome and PrincipeSaudi ArabiaSenegalSerbiaSeychellesSierra LeoneSingaporeSlovak RepublicSloveniaSmall statesSolomon IslandsSomaliaSouth AfricaSouth AsiaSouth Asia (IDA & IBRD)SpainSri LankaSt. Kitts and NevisSt. LuciaSt. Vincent and the GrenadinesSub-Saharan Africa Sub-Saharan Africa (excluding high income)Sub-Saharan Africa (IDA & IBRD countries)SudanSurinameSwazilandSwedenSwitzerlandSyrian Arab RepublicTajikistanTanzaniaThailandTimor-LesteTogoTongaTrinidad and TobagoTunisiaTurkeyTurkmenistanTuvaluUgandaUkraineUnited KingdomUnited StatesUpper middle incomeUruguayUzbekistanVanuatuVenezuela, RBVietnamWest Bank and GazaWorldYemen, Rep.ZambiaZimbabwe Timeline:
This timeline shows a graph from 1961 to 2016 of Honduras. No data until 1960. Number of actual observations by date: 56.
Source name:
World Development Indicators
Source organization:
World Bank national accounts data, and OECD National Accounts data files.
Categories, topics:
Economy & Growth
Last updated:
apr 23, 2017
Indicators value changes by year
Minimum:
40.571
jan 1, 1969
At the date of observation
Value
Absolute change
Change from previous value
jan 1, 1961
43.705
+43.705
0.0%
jan 1, 1962
42.864
-0.841
-1.92%
jan 1, 1963
41.697
-1.167
-2.72%
jan 1, 1964
42.741
+1.044
2.5%
jan 1, 1965
42.589
-0.152
-0.35%
jan 1, 1966
40.821
-1.769
-4.15%
jan 1, 1967
41.662
+0.841
2.06%
jan 1, 1968
40.714
-0.948
-2.27%
jan 1, 1969
40.571
-0.143
-0.35%
jan 1, 1970
42.132
+1.561
3.85%
jan 1, 1971
45.371
+3.239
7.69%
jan 1, 1972
46.02
+0.649
1.43%
jan 1, 1973
46.46
+0.441
0.96%
jan 1, 1974
45.136
-1.325
-2.85%
jan 1, 1975
45.241
+0.105
0.23%
jan 1, 1976
47.755
+2.515
5.56%
jan 1, 1977
48.216
+0.46
0.96%
jan 1, 1978
46.214
-2.002
-4.15%
jan 1, 1979
48.529
+2.315
5.01%
jan 1, 1980
50.037
+1.508
3.11%
jan 1, 1981
52.014
+1.976
3.95%
jan 1, 1982
54.681
+2.667
5.13%
jan 1, 1983
53.929
-0.752
-1.38%
jan 1, 1984
53.495
-0.434
-0.8%
jan 1, 1985
53.336
-0.159
-0.3%
jan 1, 1986
54.178
+0.843
1.58%
jan 1, 1987
55.907
+1.728
3.19%
jan 1, 1988
56.12
+0.214
0.38%
jan 1, 1989
54.758
-1.362
-2.43%
jan 1, 1990
54.213
-0.544
-0.99%
jan 1, 1991
51.201
-3.012
-5.56%
jan 1, 1992
49.961
-1.241
-2.42%
jan 1, 1993
50.034
+0.073
0.15%
jan 1, 1994
49.295
-0.739
-1.48%
jan 1, 1995
46.859
-2.436
-4.94%
jan 1, 1996
47.766
+0.906
1.93%
jan 1, 1997
46.924
-0.841
-1.76%
jan 1, 1998
47.118
+0.194
0.41%
jan 1, 1999
50.195
+3.077
6.53%
jan 1, 2000
51.712
+1.517
3.02%
jan 1, 2001
51.661
-0.052
-0.1%
jan 1, 2002
54.723
+3.063
5.93%
jan 1, 2003
56.447
+1.724
3.15%
jan 1, 2004
57.17
+0.723
1.28%
jan 1, 2005
57.503
+0.333
0.58%
jan 1, 2006
57.622
+0.118
0.21%
jan 1, 2007
57.687
+0.065
0.11%
jan 1, 2008
58.428
+0.742
1.29%
jan 1, 2009
58.888
+0.46
0.79%
jan 1, 2010
60.27
+1.382
2.35%
jan 1, 2011
59.935
-0.335
-0.56%
jan 1, 2012
56.927
-3.008
-5.02%
jan 1, 2013
57.276
+0.35
0.61%
jan 1, 2014
59.546
+2.27
3.96%
jan 1, 2015
59.794
+0.248
0.42%
jan 1, 2016
58.778
-1.016
-1.7%
Ranking of countries by current statistics by years


Comments: