29
/
en
AIzaSyAYiBZKx7MnpbEhh9jyipgxe19OcubqV5w
April 1, 2024
91193
Brazil
BRA
true
2
1
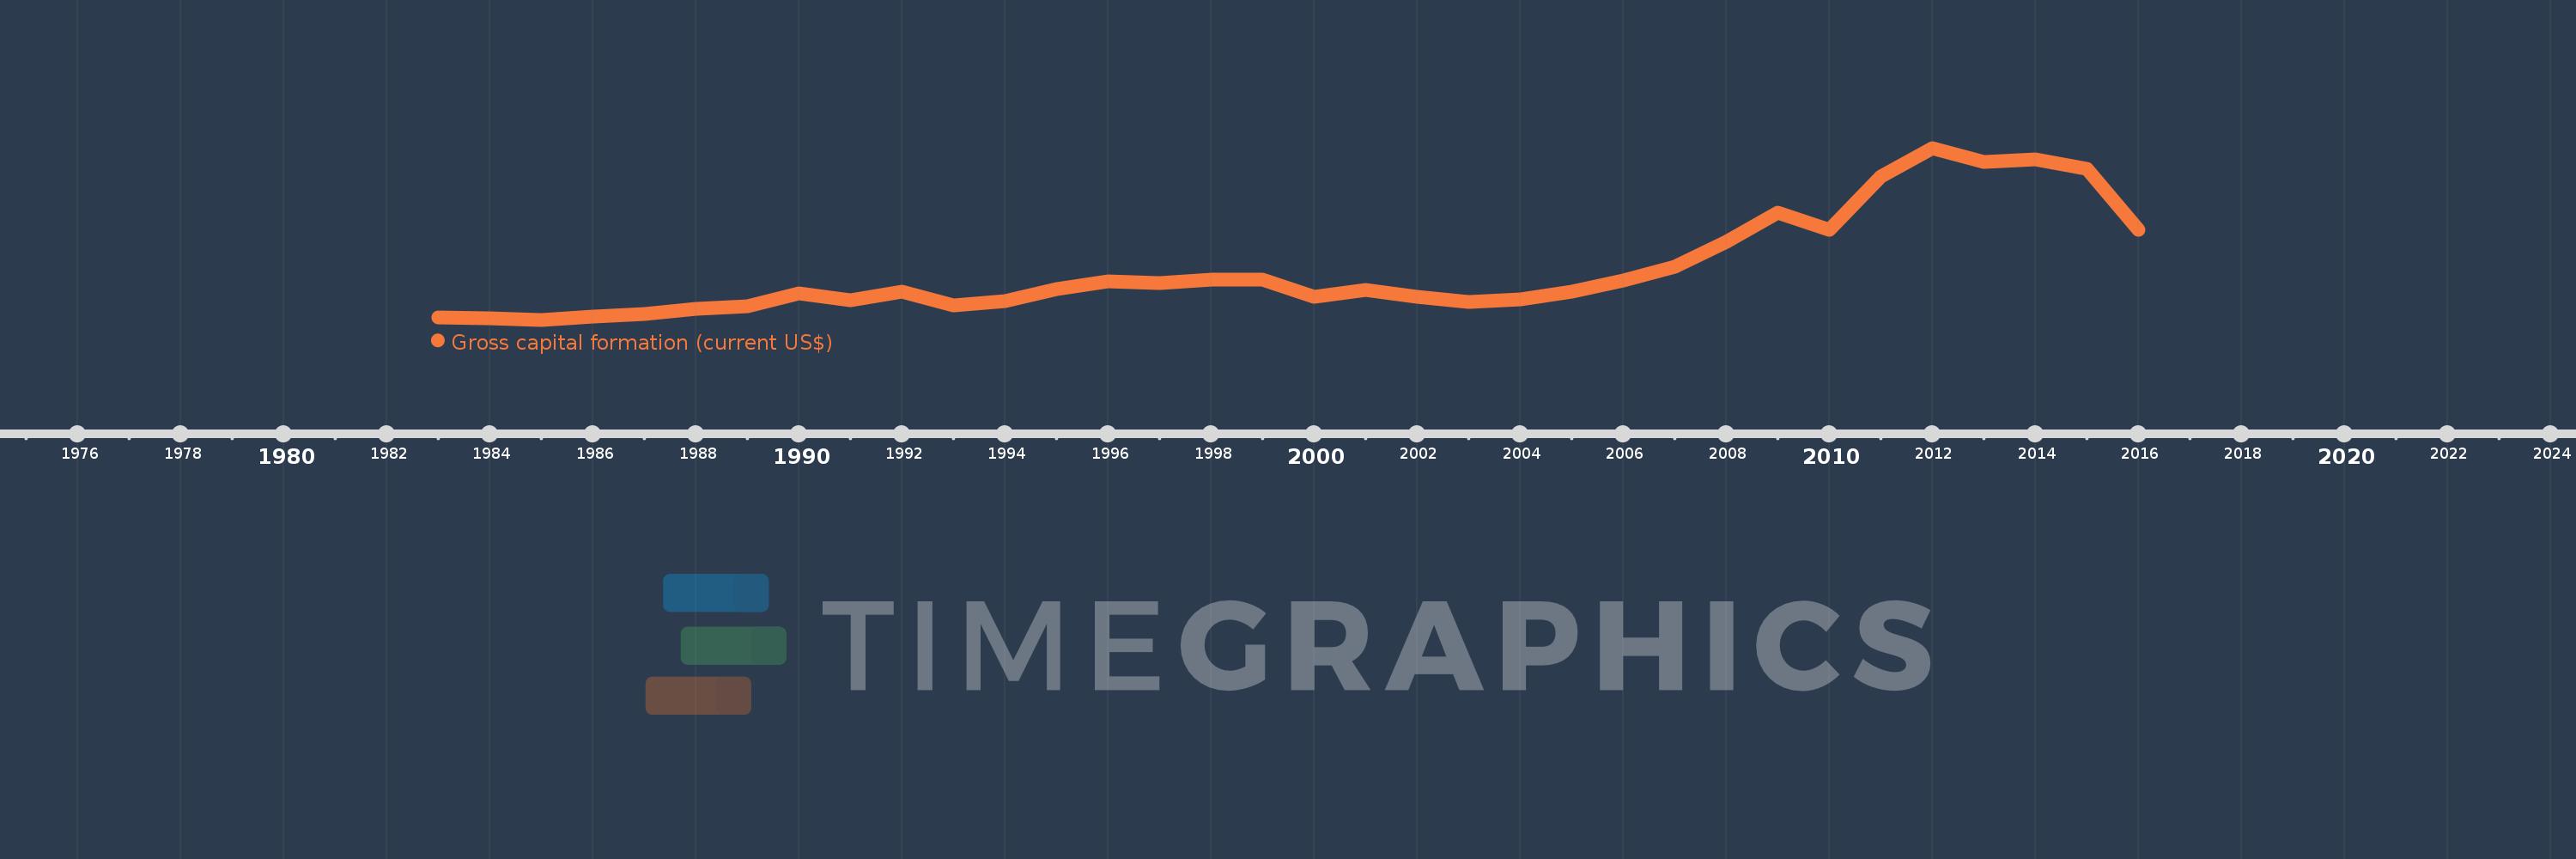
Gross capital formation (current US$)
2016,2015,2014,2013,2012,2011,2010,2009,2008,2007,2006,2005,2004,2003,2002,2001,2000,1999,1998,1997,1996,1995,1994,1993,1992,1991,1990,1989,1988,1987,1986,1985,1984,1983
This statistics in other country:
AfghanistanAlbaniaAlgeriaAngolaAntigua and BarbudaArab WorldArgentinaArmeniaArubaAustraliaAustriaAzerbaijanBahamas, TheBahrainBangladeshBarbadosBelarusBelgiumBelizeBeninBermudaBhutanBoliviaBosnia and HerzegovinaBotswanaBrazilBrunei DarussalamBulgariaBurkina FasoBurundiCabo VerdeCambodiaCameroonCanadaCaribbean small statesCentral African RepublicCentral Europe and the BalticsChadChileChinaColombiaComorosCongo, Dem. Rep.Congo, Rep.Costa RicaCote d'IvoireCroatiaCubaCyprusCzech RepublicDenmarkDjiboutiDominicaDominican RepublicEarly-demographic dividendEast Asia & PacificEast Asia & Pacific (excluding high income)East Asia & Pacific (IDA & IBRD countries)EcuadorEgypt, Arab Rep.El SalvadorEquatorial GuineaEritreaEstoniaEthiopiaEuro areaEurope & Central AsiaEurope & Central Asia (excluding high income)Europe & Central Asia (IDA & IBRD countries)European UnionFaroe IslandsFijiFinlandFragile and conflict affected situationsFranceGabonGambia, TheGeorgiaGermanyGhanaGreeceGrenadaGuatemalaGuineaGuinea-BissauGuyanaHaitiHeavily indebted poor countries (HIPC)High incomeHondurasHong Kong SAR, ChinaHungaryIBRD onlyIcelandIDA & IBRD totalIDA blendIDA onlyIDA totalIndiaIndonesiaIran, Islamic Rep.IraqIrelandIsraelItalyJamaicaJapanJordanKazakhstanKenyaKiribatiKorea, Rep.KosovoKuwaitKyrgyz RepublicLao PDRLate-demographic dividendLatin America & Caribbean Latin America & Caribbean (excluding high income)Latin America & the Caribbean (IDA & IBRD countries)LatviaLeast developed countries: UN classificationLebanonLesothoLiberiaLibyaLithuaniaLow & middle incomeLow incomeLower middle incomeLuxembourgMacao SAR, ChinaMacedonia, FYRMadagascarMalawiMalaysiaMaldivesMaliMaltaMauritaniaMauritiusMexicoMicronesia, Fed. Sts.Middle East & North AfricaMiddle East & North Africa (excluding high income)Middle East & North Africa (IDA & IBRD countries)Middle incomeMoldovaMongoliaMontenegroMoroccoMozambiqueNamibiaNepalNetherlandsNew CaledoniaNew ZealandNicaraguaNigerNigeriaNorth AmericaNorwayOECD membersOmanOther small statesPakistanPanamaPapua New GuineaParaguayPeruPhilippinesPolandPortugalPost-demographic dividendPre-demographic dividendPuerto RicoQatarRomaniaRussian FederationRwandaSaudi ArabiaSenegalSerbiaSeychellesSierra LeoneSingaporeSlovak RepublicSloveniaSmall statesSolomon IslandsSouth AfricaSouth AsiaSouth Asia (IDA & IBRD)South SudanSpainSri LankaSt. Kitts and NevisSt. LuciaSt. Vincent and the GrenadinesSub-Saharan Africa Sub-Saharan Africa (excluding high income)Sub-Saharan Africa (IDA & IBRD countries)SudanSurinameSwazilandSwedenSwitzerlandSyrian Arab RepublicTajikistanTanzaniaThailandTimor-LesteTogoTongaTrinidad and TobagoTunisiaTurkeyTurkmenistanUgandaUkraineUnited Arab EmiratesUnited KingdomUnited StatesUpper middle incomeUruguayUzbekistanVanuatuVenezuela, RBVietnamWest Bank and GazaWorldYemen, Rep.ZambiaZimbabwe Timeline:
This timeline shows a graph from 1983 to 2016 of Brazil. No data until 1982. Number of actual observations by date: 34.
Source name:
World Development Indicators
Source organization:
World Bank national accounts data, and OECD National Accounts data files.
Categories, topics:
Economy & Growth
Last updated:
apr 23, 2017
Indicators value changes by year
Minimum:
31.57 bln
jan 1, 1985
Maximum:
570.337 bln
jan 1, 2012
At the date of observation
Value
Absolute change
Change from previous value
jan 1, 1983
38.767 bln
+38.767 bln
0.0%
jan 1, 1984
35.566 bln
-3.202 bln
-8.26%
jan 1, 1985
31.57 bln
-3.995 bln
-11.23%
jan 1, 1986
41.969 bln
+10.399 bln
32.94%
jan 1, 1987
50.848 bln
+8.878 bln
21.15%
jan 1, 1988
65.434 bln
+14.586 bln
28.69%
jan 1, 1989
75.04 bln
+9.606 bln
14.68%
jan 1, 1990
114.497 bln
+39.457 bln
52.58%
jan 1, 1991
93.16 bln
-21.337 bln
-18.64%
jan 1, 1992
119.18 bln
+26.02 bln
27.93%
jan 1, 1993
75.852 bln
-43.328 bln
-36.36%
jan 1, 1994
91.265 bln
+15.413 bln
20.32%
jan 1, 1995
128.329 bln
+37.064 bln
40.61%
jan 1, 1996
150.667 bln
+22.337 bln
17.41%
jan 1, 1997
146.843 bln
-3.824 bln
-2.54%
jan 1, 1998
156.891 bln
+10.048 bln
6.84%
jan 1, 1999
156.893 bln
+1.253 mln
0.0%
jan 1, 2000
104.231 bln
-52.662 bln
-33.57%
jan 1, 2001
123.895 bln
+19.664 bln
18.87%
jan 1, 2002
104.836 bln
-19.059 bln
-15.38%
jan 1, 2003
88.635 bln
-16.202 bln
-15.45%
jan 1, 2004
94.114 bln
+5.48 bln
6.18%
jan 1, 2005
119.891 bln
+25.777 bln
27.39%
jan 1, 2006
153.404 bln
+33.512 bln
27.95%
jan 1, 2007
197.343 bln
+43.939 bln
28.64%
jan 1, 2008
276.893 bln
+79.55 bln
40.31%
jan 1, 2009
366.627 bln
+89.734 bln
32.41%
jan 1, 2010
313.335 bln
-53.292 bln
-14.54%
jan 1, 2011
481.563 bln
+168.228 bln
53.69%
jan 1, 2012
570.337 bln
+88.774 bln
18.43%
jan 1, 2013
526.886 bln
-43.451 bln
-7.62%
jan 1, 2014
535.843 bln
+8.956 bln
1.7%
jan 1, 2015
504.305 bln
-31.538 bln
-5.89%
jan 1, 2016
314.338 bln
-189.967 bln
-37.67%
Ranking of countries by current statistics by years


Comments: