29
/
en
AIzaSyAYiBZKx7MnpbEhh9jyipgxe19OcubqV5w
April 1, 2024
281022
Venezuela, RB
VEN
true
2
1
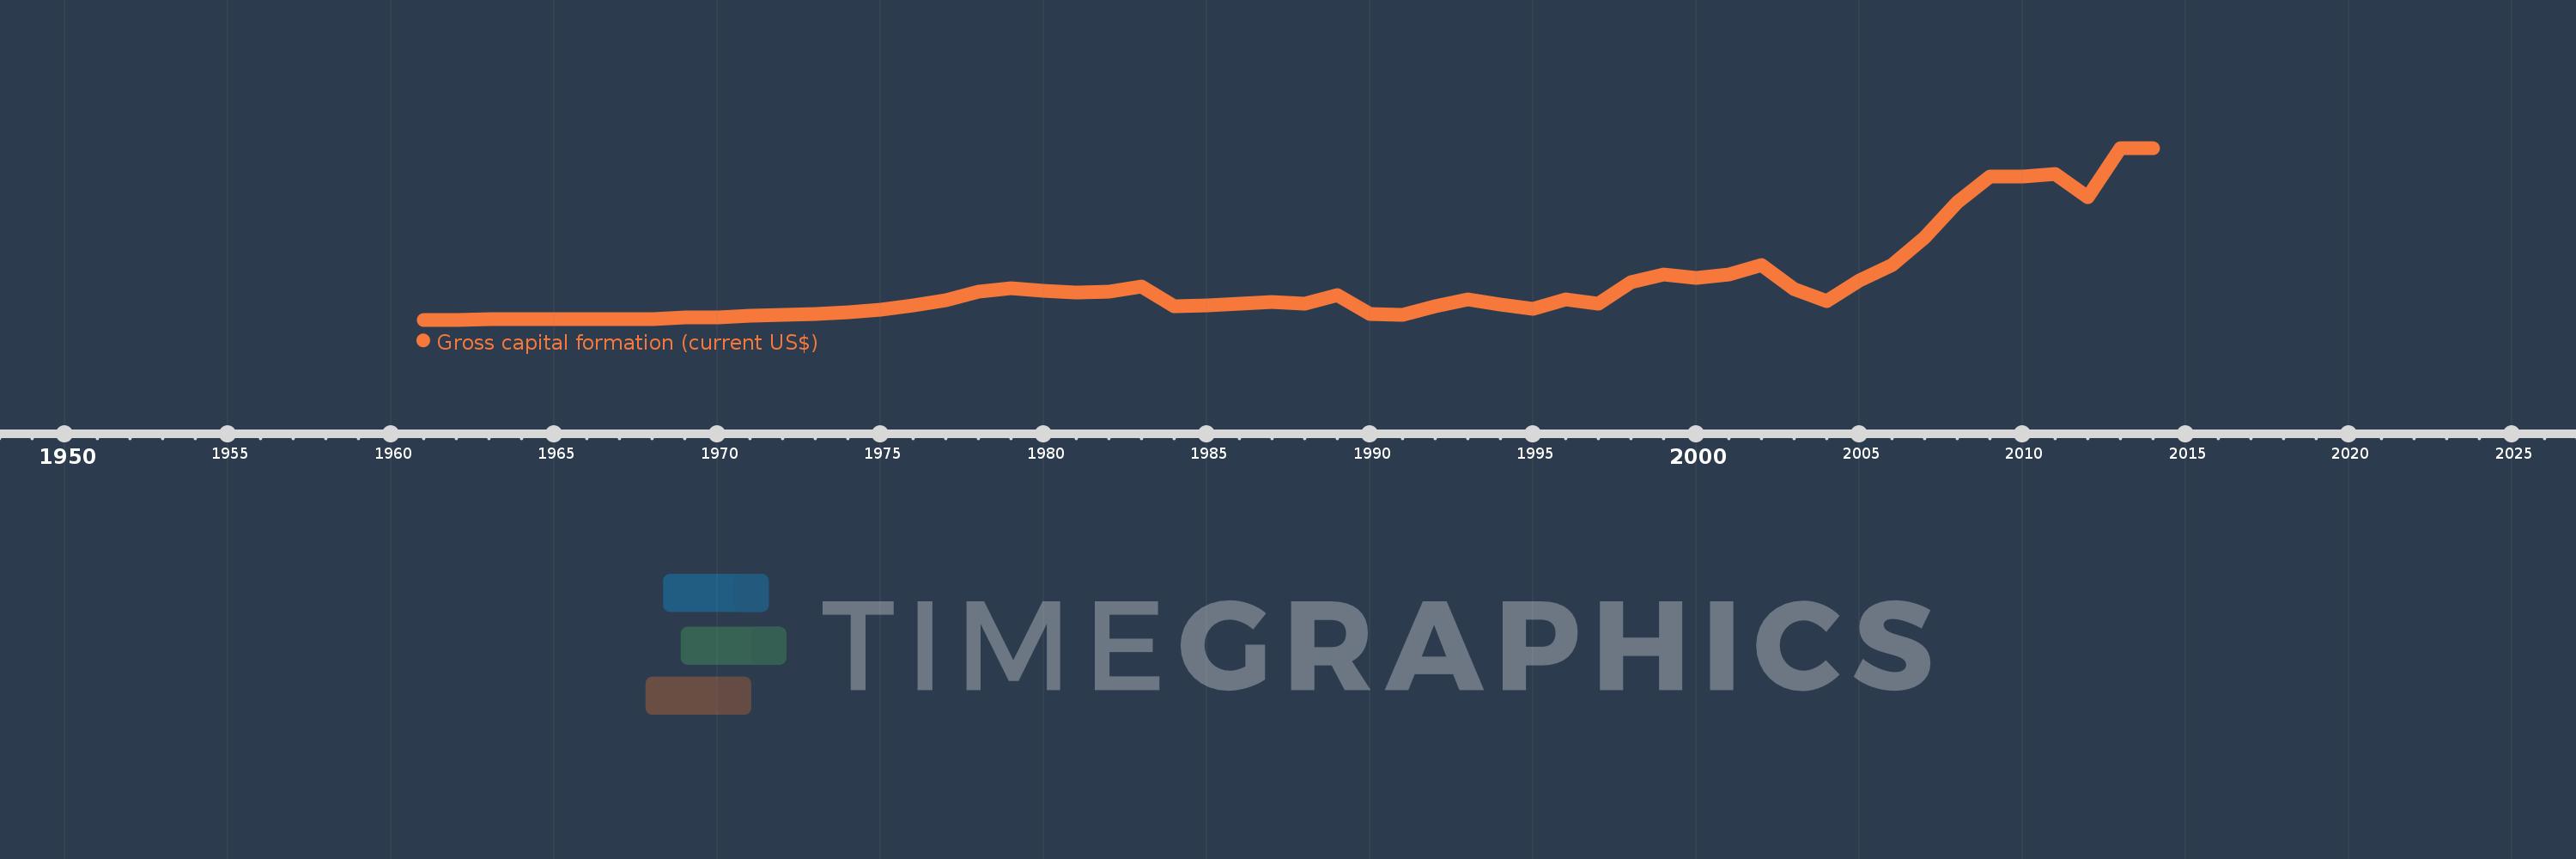
Gross capital formation (current US$)
2014,2013,2012,2011,2010,2009,2008,2007,2006,2005,2004,2003,2002,2001,2000,1999,1998,1997,1996,1995,1994,1993,1992,1991,1990,1989,1988,1987,1986,1985,1984,1983,1982,1981,1980,1979,1978,1977,1976,1975,1974,1973,1972,1971,1970,1969,1968,1967,1966,1965,1964,1963,1962,1961
This statistics in other country:
AfghanistanAlbaniaAlgeriaAngolaAntigua and BarbudaArab WorldArgentinaArmeniaArubaAustraliaAustriaAzerbaijanBahamas, TheBahrainBangladeshBarbadosBelarusBelgiumBelizeBeninBermudaBhutanBoliviaBosnia and HerzegovinaBotswanaBrazilBrunei DarussalamBulgariaBurkina FasoBurundiCabo VerdeCambodiaCameroonCanadaCaribbean small statesCentral African RepublicCentral Europe and the BalticsChadChileChinaColombiaComorosCongo, Dem. Rep.Congo, Rep.Costa RicaCote d'IvoireCroatiaCubaCyprusCzech RepublicDenmarkDjiboutiDominicaDominican RepublicEarly-demographic dividendEast Asia & PacificEast Asia & Pacific (excluding high income)East Asia & Pacific (IDA & IBRD countries)EcuadorEgypt, Arab Rep.El SalvadorEquatorial GuineaEritreaEstoniaEthiopiaEuro areaEurope & Central AsiaEurope & Central Asia (excluding high income)Europe & Central Asia (IDA & IBRD countries)European UnionFaroe IslandsFijiFinlandFragile and conflict affected situationsFranceGabonGambia, TheGeorgiaGermanyGhanaGreeceGrenadaGuatemalaGuineaGuinea-BissauGuyanaHaitiHeavily indebted poor countries (HIPC)High incomeHondurasHong Kong SAR, ChinaHungaryIBRD onlyIcelandIDA & IBRD totalIDA blendIDA onlyIDA totalIndiaIndonesiaIran, Islamic Rep.IraqIrelandIsraelItalyJamaicaJapanJordanKazakhstanKenyaKiribatiKorea, Rep.KosovoKuwaitKyrgyz RepublicLao PDRLate-demographic dividendLatin America & Caribbean Latin America & Caribbean (excluding high income)Latin America & the Caribbean (IDA & IBRD countries)LatviaLeast developed countries: UN classificationLebanonLesothoLiberiaLibyaLithuaniaLow & middle incomeLow incomeLower middle incomeLuxembourgMacao SAR, ChinaMacedonia, FYRMadagascarMalawiMalaysiaMaldivesMaliMaltaMauritaniaMauritiusMexicoMicronesia, Fed. Sts.Middle East & North AfricaMiddle East & North Africa (excluding high income)Middle East & North Africa (IDA & IBRD countries)Middle incomeMoldovaMongoliaMontenegroMoroccoMozambiqueNamibiaNepalNetherlandsNew CaledoniaNew ZealandNicaraguaNigerNigeriaNorth AmericaNorwayOECD membersOmanOther small statesPakistanPanamaPapua New GuineaParaguayPeruPhilippinesPolandPortugalPost-demographic dividendPre-demographic dividendPuerto RicoQatarRomaniaRussian FederationRwandaSaudi ArabiaSenegalSerbiaSeychellesSierra LeoneSingaporeSlovak RepublicSloveniaSmall statesSolomon IslandsSouth AfricaSouth AsiaSouth Asia (IDA & IBRD)South SudanSpainSri LankaSt. Kitts and NevisSt. LuciaSt. Vincent and the GrenadinesSub-Saharan Africa Sub-Saharan Africa (excluding high income)Sub-Saharan Africa (IDA & IBRD countries)SudanSurinameSwazilandSwedenSwitzerlandSyrian Arab RepublicTajikistanTanzaniaThailandTimor-LesteTogoTongaTrinidad and TobagoTunisiaTurkeyTurkmenistanUgandaUkraineUnited Arab EmiratesUnited KingdomUnited StatesUpper middle incomeUruguayUzbekistanVanuatuVenezuela, RBVietnamWest Bank and GazaWorldYemen, Rep.ZambiaZimbabwe Timeline:
This timeline shows a graph from 1961 to 2014 of Venezuela, RB. No data until 1960. Number of actual observations by date: 54.
Source name:
World Development Indicators
Source organization:
World Bank national accounts data, and OECD National Accounts data files.
Categories, topics:
Economy & Growth
Last updated:
apr 23, 2017
Indicators value changes by year
Minimum:
1.911 bln
jan 1, 1961
Maximum:
101.41 bln
jan 1, 2013
At the date of observation
Value
Absolute change
Change from previous value
jan 1, 1961
1.911 bln
+1.911 bln
0.0%
jan 1, 1962
1.949 bln
+37.758 mln
1.98%
jan 1, 1963
2.151 bln
+202.303 mln
10.38%
jan 1, 1964
2.179 bln
+27.848 mln
1.29%
jan 1, 1965
2.35 bln
+170.705 mln
7.83%
jan 1, 1966
2.357 bln
+7.071 mln
0.3%
jan 1, 1967
2.393 bln
+36.556 mln
1.55%
jan 1, 1968
2.486 bln
+92.467 mln
3.86%
jan 1, 1969
3.258 bln
+772.0 mln
31.06%
jan 1, 1970
3.494 bln
+236.533 mln
7.26%
jan 1, 1971
4.226 bln
+731.156 mln
20.92%
jan 1, 1972
4.706 bln
+480.899 mln
11.38%
jan 1, 1973
5.278 bln
+571.818 mln
12.15%
jan 1, 1974
6.031 bln
+752.867 mln
14.26%
jan 1, 1975
7.584 bln
+1.553 bln
25.75%
jan 1, 1976
10.262 bln
+2.678 bln
35.31%
jan 1, 1977
13.075 bln
+2.813 bln
27.41%
jan 1, 1978
18.206 bln
+5.131 bln
39.24%
jan 1, 1979
20.389 bln
+2.183 bln
11.99%
jan 1, 1980
18.476 bln
-1.913 bln
-9.38%
jan 1, 1981
17.688 bln
-787.651 mln
-4.26%
jan 1, 1982
18.409 bln
+720.14 mln
4.07%
jan 1, 1983
21.199 bln
+2.791 bln
15.16%
jan 1, 1984
9.587 bln
-11.612 bln
-54.78%
jan 1, 1985
10.164 bln
+577.04 mln
6.02%
jan 1, 1986
11.094 bln
+929.94 mln
9.15%
jan 1, 1987
12.236 bln
+1.142 bln
10.29%
jan 1, 1988
11.42 bln
-815.463 mln
-6.66%
jan 1, 1989
16.293 bln
+4.873 bln
42.67%
jan 1, 1990
5.35 bln
-10.944 bln
-67.17%
jan 1, 1991
4.806 bln
-543.269 mln
-10.16%
jan 1, 1992
9.666 bln
+4.859 bln
101.11%
jan 1, 1993
13.865 bln
+4.199 bln
43.45%
jan 1, 1994
10.899 bln
-2.966 bln
-21.39%
jan 1, 1995
8.003 bln
-2.896 bln
-26.57%
jan 1, 1996
13.568 bln
+5.566 bln
69.55%
jan 1, 1997
11.301 bln
-2.268 bln
-16.71%
jan 1, 1998
23.755 bln
+12.454 bln
110.21%
jan 1, 1999
28.003 bln
+4.247 bln
17.88%
jan 1, 2000
25.98 bln
-2.022 bln
-7.22%
jan 1, 2001
28.313 bln
+2.333 bln
8.98%
jan 1, 2002
33.828 bln
+5.515 bln
19.48%
jan 1, 2003
19.655 bln
-14.173 bln
-41.9%
jan 1, 2004
12.725 bln
-6.93 bln
-35.26%
jan 1, 2005
24.513 bln
+11.788 bln
92.64%
jan 1, 2006
33.473 bln
+8.96 bln
36.55%
jan 1, 2007
49.396 bln
+15.922 bln
47.57%
jan 1, 2008
69.893 bln
+20.497 bln
41.5%
jan 1, 2009
84.663 bln
+14.771 bln
21.13%
jan 1, 2010
84.98 bln
+316.728 mln
0.37%
jan 1, 2011
86.525 bln
+1.545 bln
1.82%
jan 1, 2012
73.02 bln
-13.505 bln
-15.61%
jan 1, 2013
101.41 bln
+28.39 bln
38.88%
jan 1, 2014
101.26 bln
-150.113 mln
-0.15%
Ranking of countries by current statistics by years


Comments: