29
/
en
AIzaSyAYiBZKx7MnpbEhh9jyipgxe19OcubqV5w
April 1, 2024
96163
Burundi
BDI
true
2
1
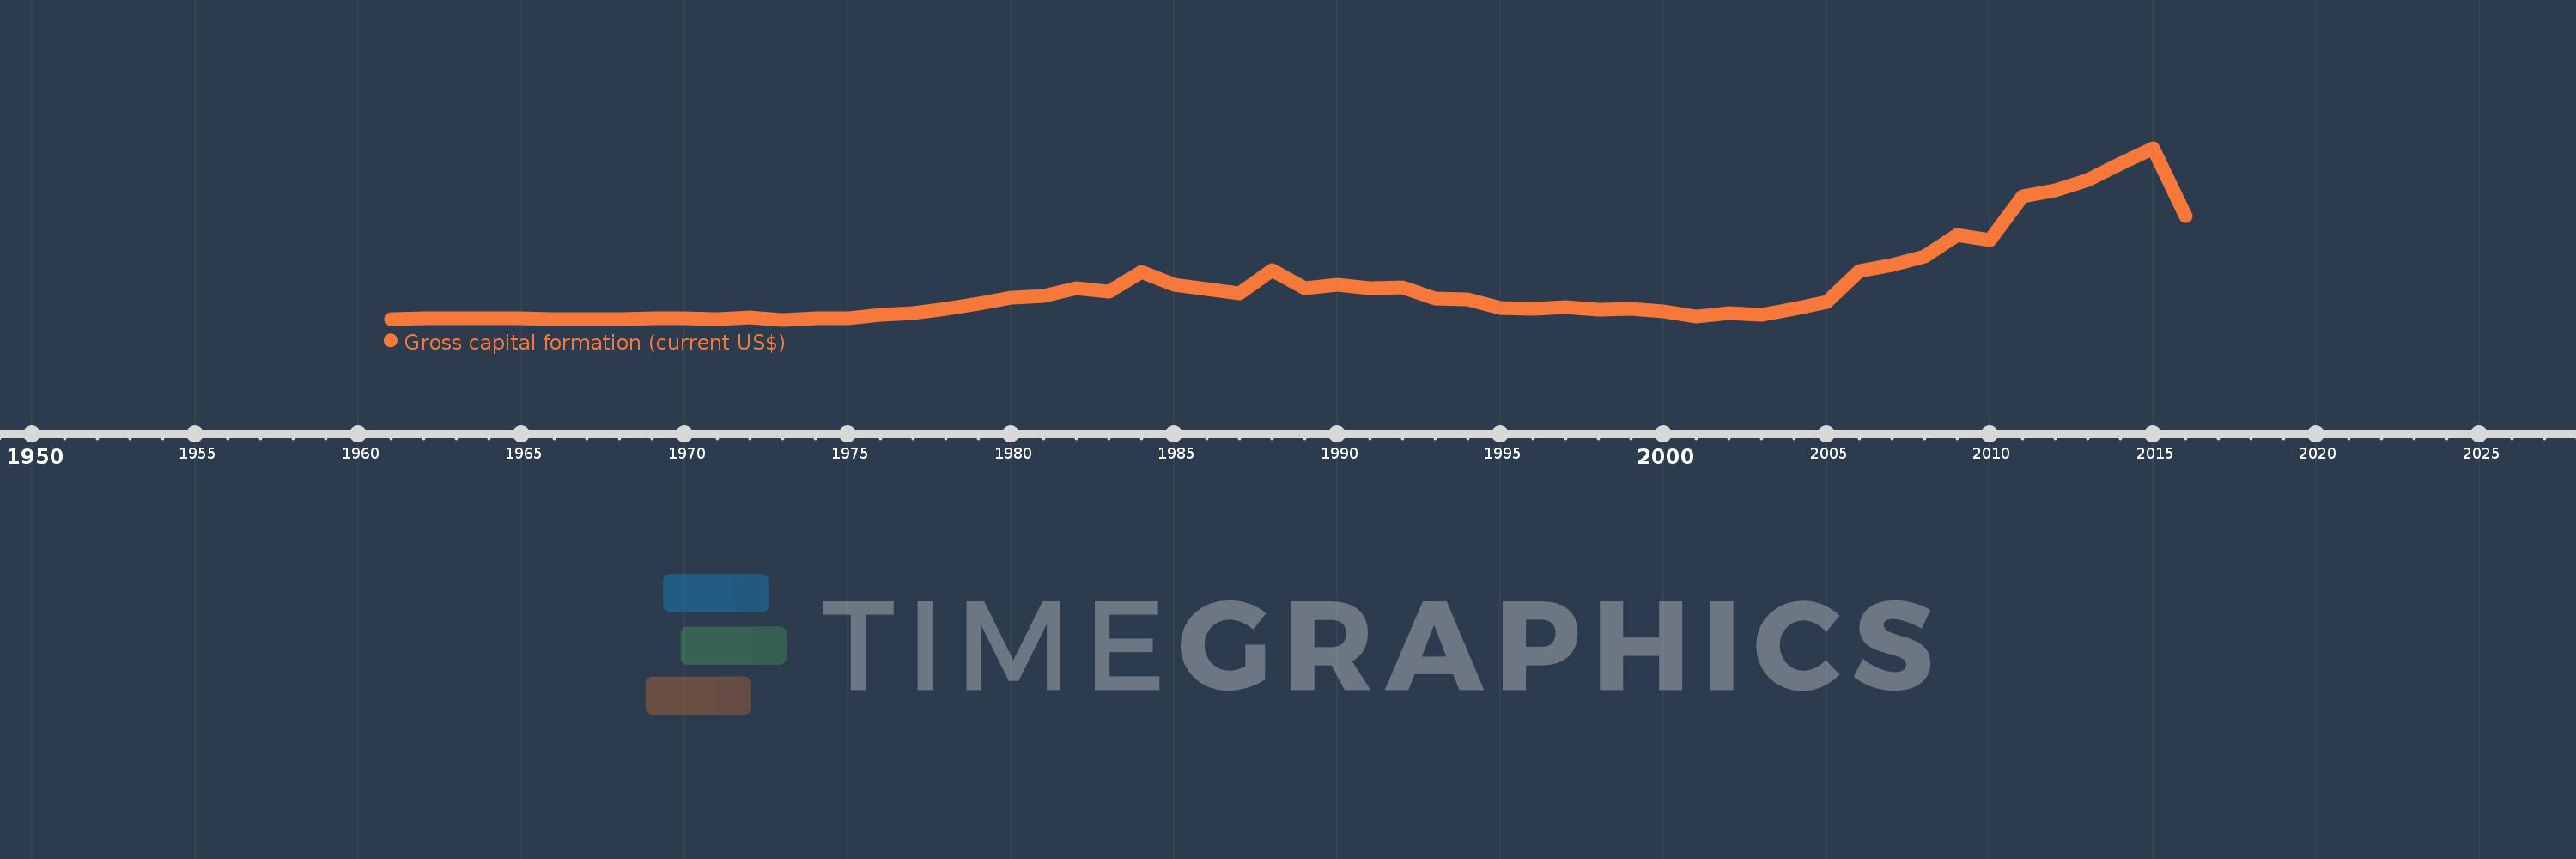
Gross capital formation (current US$)
2016,2015,2014,2013,2012,2011,2010,2009,2008,2007,2006,2005,2004,2003,2002,2001,2000,1999,1998,1997,1996,1995,1994,1993,1992,1991,1990,1989,1988,1987,1986,1985,1984,1983,1982,1981,1980,1979,1978,1977,1976,1975,1974,1973,1972,1971,1970,1969,1968,1967,1966,1965,1964,1963,1962,1961
This statistics in other country:
AfghanistanAlbaniaAlgeriaAngolaAntigua and BarbudaArab WorldArgentinaArmeniaArubaAustraliaAustriaAzerbaijanBahamas, TheBahrainBangladeshBarbadosBelarusBelgiumBelizeBeninBermudaBhutanBoliviaBosnia and HerzegovinaBotswanaBrazilBrunei DarussalamBulgariaBurkina FasoBurundiCabo VerdeCambodiaCameroonCanadaCaribbean small statesCentral African RepublicCentral Europe and the BalticsChadChileChinaColombiaComorosCongo, Dem. Rep.Congo, Rep.Costa RicaCote d'IvoireCroatiaCubaCyprusCzech RepublicDenmarkDjiboutiDominicaDominican RepublicEarly-demographic dividendEast Asia & PacificEast Asia & Pacific (excluding high income)East Asia & Pacific (IDA & IBRD countries)EcuadorEgypt, Arab Rep.El SalvadorEquatorial GuineaEritreaEstoniaEthiopiaEuro areaEurope & Central AsiaEurope & Central Asia (excluding high income)Europe & Central Asia (IDA & IBRD countries)European UnionFaroe IslandsFijiFinlandFragile and conflict affected situationsFranceGabonGambia, TheGeorgiaGermanyGhanaGreeceGrenadaGuatemalaGuineaGuinea-BissauGuyanaHaitiHeavily indebted poor countries (HIPC)High incomeHondurasHong Kong SAR, ChinaHungaryIBRD onlyIcelandIDA & IBRD totalIDA blendIDA onlyIDA totalIndiaIndonesiaIran, Islamic Rep.IraqIrelandIsraelItalyJamaicaJapanJordanKazakhstanKenyaKiribatiKorea, Rep.KosovoKuwaitKyrgyz RepublicLao PDRLate-demographic dividendLatin America & Caribbean Latin America & Caribbean (excluding high income)Latin America & the Caribbean (IDA & IBRD countries)LatviaLeast developed countries: UN classificationLebanonLesothoLiberiaLibyaLithuaniaLow & middle incomeLow incomeLower middle incomeLuxembourgMacao SAR, ChinaMacedonia, FYRMadagascarMalawiMalaysiaMaldivesMaliMaltaMauritaniaMauritiusMexicoMicronesia, Fed. Sts.Middle East & North AfricaMiddle East & North Africa (excluding high income)Middle East & North Africa (IDA & IBRD countries)Middle incomeMoldovaMongoliaMontenegroMoroccoMozambiqueNamibiaNepalNetherlandsNew CaledoniaNew ZealandNicaraguaNigerNigeriaNorth AmericaNorwayOECD membersOmanOther small statesPakistanPanamaPapua New GuineaParaguayPeruPhilippinesPolandPortugalPost-demographic dividendPre-demographic dividendPuerto RicoQatarRomaniaRussian FederationRwandaSaudi ArabiaSenegalSerbiaSeychellesSierra LeoneSingaporeSlovak RepublicSloveniaSmall statesSolomon IslandsSouth AfricaSouth AsiaSouth Asia (IDA & IBRD)South SudanSpainSri LankaSt. Kitts and NevisSt. LuciaSt. Vincent and the GrenadinesSub-Saharan Africa Sub-Saharan Africa (excluding high income)Sub-Saharan Africa (IDA & IBRD countries)SudanSurinameSwazilandSwedenSwitzerlandSyrian Arab RepublicTajikistanTanzaniaThailandTimor-LesteTogoTongaTrinidad and TobagoTunisiaTurkeyTurkmenistanUgandaUkraineUnited Arab EmiratesUnited KingdomUnited StatesUpper middle incomeUruguayUzbekistanVanuatuVenezuela, RBVietnamWest Bank and GazaWorldYemen, Rep.ZambiaZimbabwe Timeline:
This timeline shows a graph from 1961 to 2016 of Burundi. No data until 1960. Number of actual observations by date: 56.
Source name:
World Development Indicators
Source organization:
World Bank national accounts data, and OECD National Accounts data files.
Categories, topics:
Economy & Growth
Last updated:
apr 23, 2017
Indicators value changes by year
Minimum:
7.853 mln
jan 1, 1973
Maximum:
860.423 mln
jan 1, 2015
At the date of observation
Value
Absolute change
Change from previous value
jan 1, 1961
12.25 mln
+12.25 mln
0.0%
jan 1, 1962
14.0 mln
+1.75 mln
14.29%
jan 1, 1963
15.75 mln
+1.75 mln
12.5%
jan 1, 1964
14.0 mln
-1.75 mln
-11.11%
jan 1, 1965
14.0 mln
0.0
0.0%
jan 1, 1966
9.169 mln
-4.831 mln
-34.51%
jan 1, 1967
11.197 mln
+2.028 mln
22.12%
jan 1, 1968
12.216 mln
+1.019 mln
9.1%
jan 1, 1969
15.003 mln
+2.787 mln
22.82%
jan 1, 1970
15.766 mln
+762.286K
5.08%
jan 1, 1971
10.998 mln
-4.768 mln
-30.24%
jan 1, 1972
19.235 mln
+8.238 mln
74.9%
jan 1, 1973
7.853 mln
-11.383 mln
-59.18%
jan 1, 1974
16.166 mln
+8.313 mln
105.87%
jan 1, 1975
13.991 mln
-2.175 mln
-13.45%
jan 1, 1976
31.911 mln
+17.92 mln
128.08%
jan 1, 1977
40.754 mln
+8.843 mln
27.71%
jan 1, 1978
61.304 mln
+20.551 mln
50.43%
jan 1, 1979
85.657 mln
+24.352 mln
39.72%
jan 1, 1980
116.719 mln
+31.062 mln
36.26%
jan 1, 1981
127.711 mln
+10.992 mln
9.42%
jan 1, 1982
164.798 mln
+37.087 mln
29.04%
jan 1, 1983
146.486 mln
-18.312 mln
-11.11%
jan 1, 1984
247.197 mln
+100.712 mln
68.75%
jan 1, 1985
181.347 mln
-65.851 mln
-26.64%
jan 1, 1986
159.4 mln
-21.946 mln
-12.1%
jan 1, 1987
139.932 mln
-19.468 mln
-12.21%
jan 1, 1988
255.851 mln
+115.92 mln
82.84%
jan 1, 1989
162.741 mln
-93.111 mln
-36.39%
jan 1, 1990
183.384 mln
+20.643 mln
12.68%
jan 1, 1991
164.573 mln
-18.811 mln
-10.26%
jan 1, 1992
168.219 mln
+3.646 mln
2.22%
jan 1, 1993
115.217 mln
-53.003 mln
-31.51%
jan 1, 1994
108.32 mln
-6.897 mln
-5.99%
jan 1, 1995
64.513 mln
-43.807 mln
-40.44%
jan 1, 1996
63.662 mln
-851.185K
-1.32%
jan 1, 1997
71.346 mln
+7.684 mln
12.07%
jan 1, 1998
59.316 mln
-12.03 mln
-16.86%
jan 1, 1999
60.523 mln
+1.207 mln
2.03%
jan 1, 2000
47.555 mln
-12.968 mln
-21.43%
jan 1, 2001
24.209 mln
-23.345 mln
-49.09%
jan 1, 2002
39.177 mln
+14.968 mln
61.83%
jan 1, 2003
32.592 mln
-6.585 mln
-16.81%
jan 1, 2004
61.743 mln
+29.151 mln
89.44%
jan 1, 2005
94.703 mln
+32.96 mln
53.38%
jan 1, 2006
249.961 mln
+155.258 mln
163.94%
jan 1, 2007
279.532 mln
+29.571 mln
11.83%
jan 1, 2008
320.126 mln
+40.594 mln
14.52%
jan 1, 2009
429.725 mln
+109.599 mln
34.24%
jan 1, 2010
404.46 mln
-25.264 mln
-5.88%
jan 1, 2011
618.596 mln
+214.136 mln
52.94%
jan 1, 2012
649.896 mln
+31.299 mln
5.06%
jan 1, 2013
701.491 mln
+51.595 mln
7.94%
jan 1, 2014
780.287 mln
+78.796 mln
11.23%
jan 1, 2015
860.423 mln
+80.136 mln
10.27%
jan 1, 2016
523.19 mln
-337.233 mln
-39.19%
Ranking of countries by current statistics by years


Comments: