29
/
en
AIzaSyAYiBZKx7MnpbEhh9jyipgxe19OcubqV5w
April 1, 2024
222232
Peru
PER
true
2
1
Gross capital formation (current US$)
2016,2015,2014,2013,2012,2011,2010,2009,2008,2007,2006,2005,2004,2003,2002,2001,2000,1999,1998,1997,1996,1995,1994,1993,1992,1991,1990,1989,1988,1987,1986,1985,1984,1983,1982,1981,1980,1979,1978,1977,1976,1975,1974,1973,1972,1971,1970,1969,1968,1967,1966,1965,1964,1963,1962,1961
This statistics in other country:
AfghanistanAlbaniaAlgeriaAngolaAntigua and BarbudaArab WorldArgentinaArmeniaArubaAustraliaAustriaAzerbaijanBahamas, TheBahrainBangladeshBarbadosBelarusBelgiumBelizeBeninBermudaBhutanBoliviaBosnia and HerzegovinaBotswanaBrazilBrunei DarussalamBulgariaBurkina FasoBurundiCabo VerdeCambodiaCameroonCanadaCaribbean small statesCentral African RepublicCentral Europe and the BalticsChadChileChinaColombiaComorosCongo, Dem. Rep.Congo, Rep.Costa RicaCote d'IvoireCroatiaCubaCyprusCzech RepublicDenmarkDjiboutiDominicaDominican RepublicEarly-demographic dividendEast Asia & PacificEast Asia & Pacific (excluding high income)East Asia & Pacific (IDA & IBRD countries)EcuadorEgypt, Arab Rep.El SalvadorEquatorial GuineaEritreaEstoniaEthiopiaEuro areaEurope & Central AsiaEurope & Central Asia (excluding high income)Europe & Central Asia (IDA & IBRD countries)European UnionFaroe IslandsFijiFinlandFragile and conflict affected situationsFranceGabonGambia, TheGeorgiaGermanyGhanaGreeceGrenadaGuatemalaGuineaGuinea-BissauGuyanaHaitiHeavily indebted poor countries (HIPC)High incomeHondurasHong Kong SAR, ChinaHungaryIBRD onlyIcelandIDA & IBRD totalIDA blendIDA onlyIDA totalIndiaIndonesiaIran, Islamic Rep.IraqIrelandIsraelItalyJamaicaJapanJordanKazakhstanKenyaKiribatiKorea, Rep.KosovoKuwaitKyrgyz RepublicLao PDRLate-demographic dividendLatin America & Caribbean Latin America & Caribbean (excluding high income)Latin America & the Caribbean (IDA & IBRD countries)LatviaLeast developed countries: UN classificationLebanonLesothoLiberiaLibyaLithuaniaLow & middle incomeLow incomeLower middle incomeLuxembourgMacao SAR, ChinaMacedonia, FYRMadagascarMalawiMalaysiaMaldivesMaliMaltaMauritaniaMauritiusMexicoMicronesia, Fed. Sts.Middle East & North AfricaMiddle East & North Africa (excluding high income)Middle East & North Africa (IDA & IBRD countries)Middle incomeMoldovaMongoliaMontenegroMoroccoMozambiqueNamibiaNepalNetherlandsNew CaledoniaNew ZealandNicaraguaNigerNigeriaNorth AmericaNorwayOECD membersOmanOther small statesPakistanPanamaPapua New GuineaParaguayPeruPhilippinesPolandPortugalPost-demographic dividendPre-demographic dividendPuerto RicoQatarRomaniaRussian FederationRwandaSaudi ArabiaSenegalSerbiaSeychellesSierra LeoneSingaporeSlovak RepublicSloveniaSmall statesSolomon IslandsSouth AfricaSouth AsiaSouth Asia (IDA & IBRD)South SudanSpainSri LankaSt. Kitts and NevisSt. LuciaSt. Vincent and the GrenadinesSub-Saharan Africa Sub-Saharan Africa (excluding high income)Sub-Saharan Africa (IDA & IBRD countries)SudanSurinameSwazilandSwedenSwitzerlandSyrian Arab RepublicTajikistanTanzaniaThailandTimor-LesteTogoTongaTrinidad and TobagoTunisiaTurkeyTurkmenistanUgandaUkraineUnited Arab EmiratesUnited KingdomUnited StatesUpper middle incomeUruguayUzbekistanVanuatuVenezuela, RBVietnamWest Bank and GazaWorldYemen, Rep.ZambiaZimbabwe Timeline:
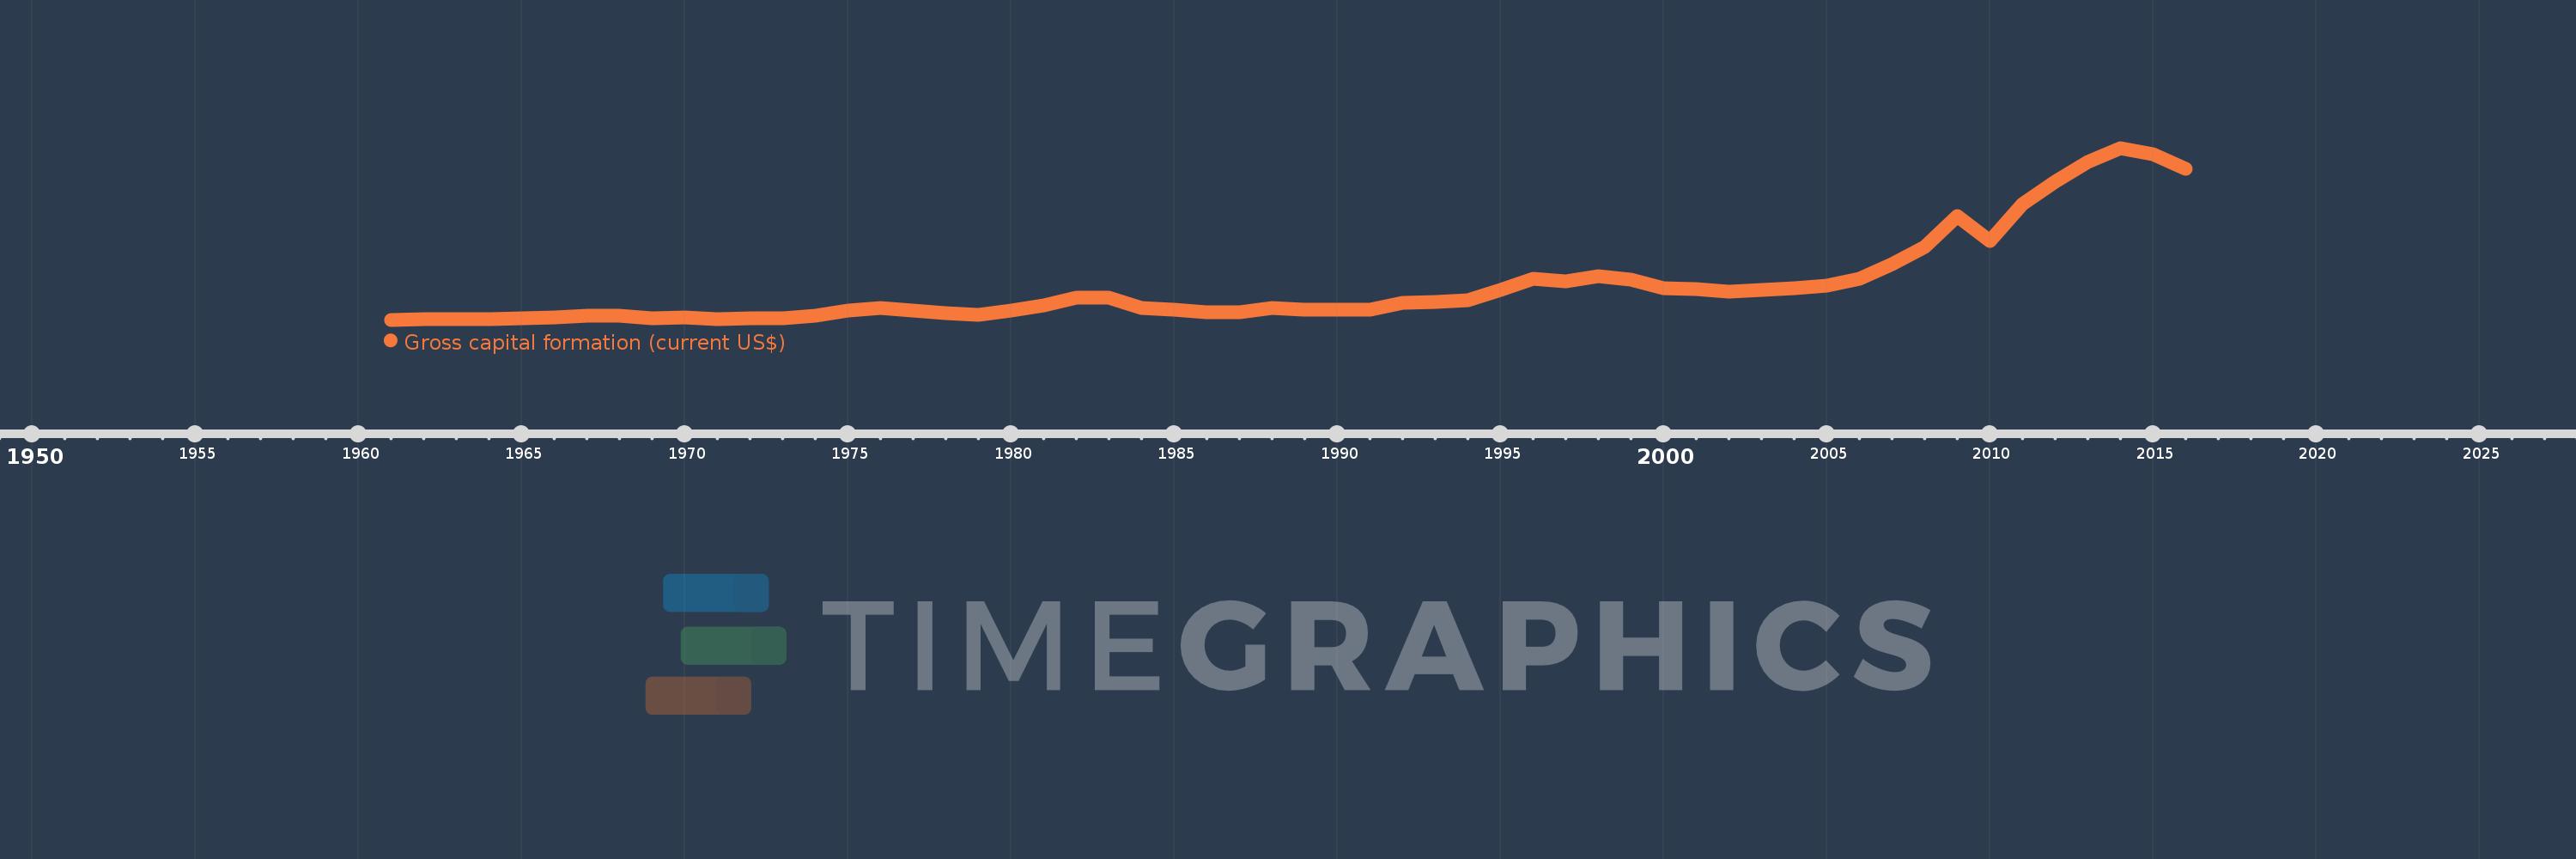
This timeline shows a graph from 1961 to 2016 of Peru. No data until 1960. Number of actual observations by date: 56.
Source name:
World Development Indicators
Source organization:
World Bank national accounts data, and OECD National Accounts data files.
Categories, topics:
Economy & Growth
Last updated:
apr 23, 2017
Indicators value changes by year
Minimum:
1.189 bln
jan 1, 1961
Maximum:
51.424 bln
jan 1, 2014
At the date of observation
Value
Absolute change
Change from previous value
jan 1, 1961
1.189 bln
+1.189 bln
0.0%
jan 1, 1962
1.312 bln
+122.718 mln
10.32%
jan 1, 1963
1.487 bln
+174.848 mln
13.33%
jan 1, 1964
1.47 bln
-16.507 mln
-1.11%
jan 1, 1965
1.667 bln
+196.729 mln
13.38%
jan 1, 1966
1.966 bln
+298.662 mln
17.92%
jan 1, 1967
2.432 bln
+466.003 mln
23.71%
jan 1, 1968
2.41 bln
-21.883 mln
-0.9%
jan 1, 1969
1.649 bln
-761.049 mln
-31.58%
jan 1, 1970
1.784 bln
+134.951 mln
8.19%
jan 1, 1971
1.273 bln
-510.469 mln
-28.62%
jan 1, 1972
1.64 bln
+366.716 mln
28.8%
jan 1, 1973
1.543 bln
-96.813 mln
-5.9%
jan 1, 1974
2.473 bln
+929.991 mln
60.27%
jan 1, 1975
3.961 bln
+1.487 bln
60.14%
jan 1, 1976
4.603 bln
+642.552 mln
16.22%
jan 1, 1977
3.865 bln
-738.054 mln
-16.03%
jan 1, 1978
3.105 bln
-759.746 mln
-19.66%
jan 1, 1979
2.676 bln
-429.252 mln
-13.82%
jan 1, 1980
3.826 bln
+1.15 bln
42.96%
jan 1, 1981
5.502 bln
+1.676 bln
43.82%
jan 1, 1982
7.528 bln
+2.026 bln
36.82%
jan 1, 1983
7.649 bln
+121.514 mln
1.61%
jan 1, 1984
4.601 bln
-3.048 bln
-39.85%
jan 1, 1985
4.126 bln
-474.912 mln
-10.32%
jan 1, 1986
3.463 bln
-663.348 mln
-16.08%
jan 1, 1987
3.417 bln
-45.414 mln
-1.31%
jan 1, 1988
4.659 bln
+1.241 bln
36.32%
jan 1, 1989
4.081 bln
-577.819 mln
-12.4%
jan 1, 1990
4.252 bln
+170.843 mln
4.19%
jan 1, 1991
4.052 bln
-200.125 mln
-4.71%
jan 1, 1992
6.115 bln
+2.063 bln
50.92%
jan 1, 1993
6.37 bln
+255.566 mln
4.18%
jan 1, 1994
6.854 bln
+483.189 mln
7.58%
jan 1, 1995
9.985 bln
+3.131 bln
45.69%
jan 1, 1996
13.189 bln
+3.204 bln
32.09%
jan 1, 1997
12.48 bln
-709.383 mln
-5.38%
jan 1, 1998
13.833 bln
+1.353 bln
10.84%
jan 1, 1999
12.879 bln
-953.87 mln
-6.9%
jan 1, 2000
10.369 bln
-2.51 bln
-19.49%
jan 1, 2001
10.156 bln
-212.879 mln
-2.05%
jan 1, 2002
9.448 bln
-708.032 mln
-6.97%
jan 1, 2003
9.843 bln
+394.091 mln
4.17%
jan 1, 2004
10.284 bln
+441.463 mln
4.49%
jan 1, 2005
11.254 bln
+970.347 mln
9.44%
jan 1, 2006
13.146 bln
+1.892 bln
16.81%
jan 1, 2007
17.419 bln
+4.273 bln
32.5%
jan 1, 2008
22.511 bln
+5.092 bln
29.23%
jan 1, 2009
31.558 bln
+9.047 bln
40.19%
jan 1, 2010
24.139 bln
-7.419 bln
-23.51%
jan 1, 2011
35.045 bln
+10.906 bln
45.18%
jan 1, 2012
41.559 bln
+6.514 bln
18.59%
jan 1, 2013
47.393 bln
+5.834 bln
14.04%
jan 1, 2014
51.424 bln
+4.031 bln
8.51%
jan 1, 2015
49.558 bln
-1.866 bln
-3.63%
jan 1, 2016
45.424 bln
-4.134 bln
-8.34%
Ranking of countries by current statistics by years


Comments: