29
/
en
AIzaSyAYiBZKx7MnpbEhh9jyipgxe19OcubqV5w
April 1, 2024
133191
Finland
FIN
true
2
1
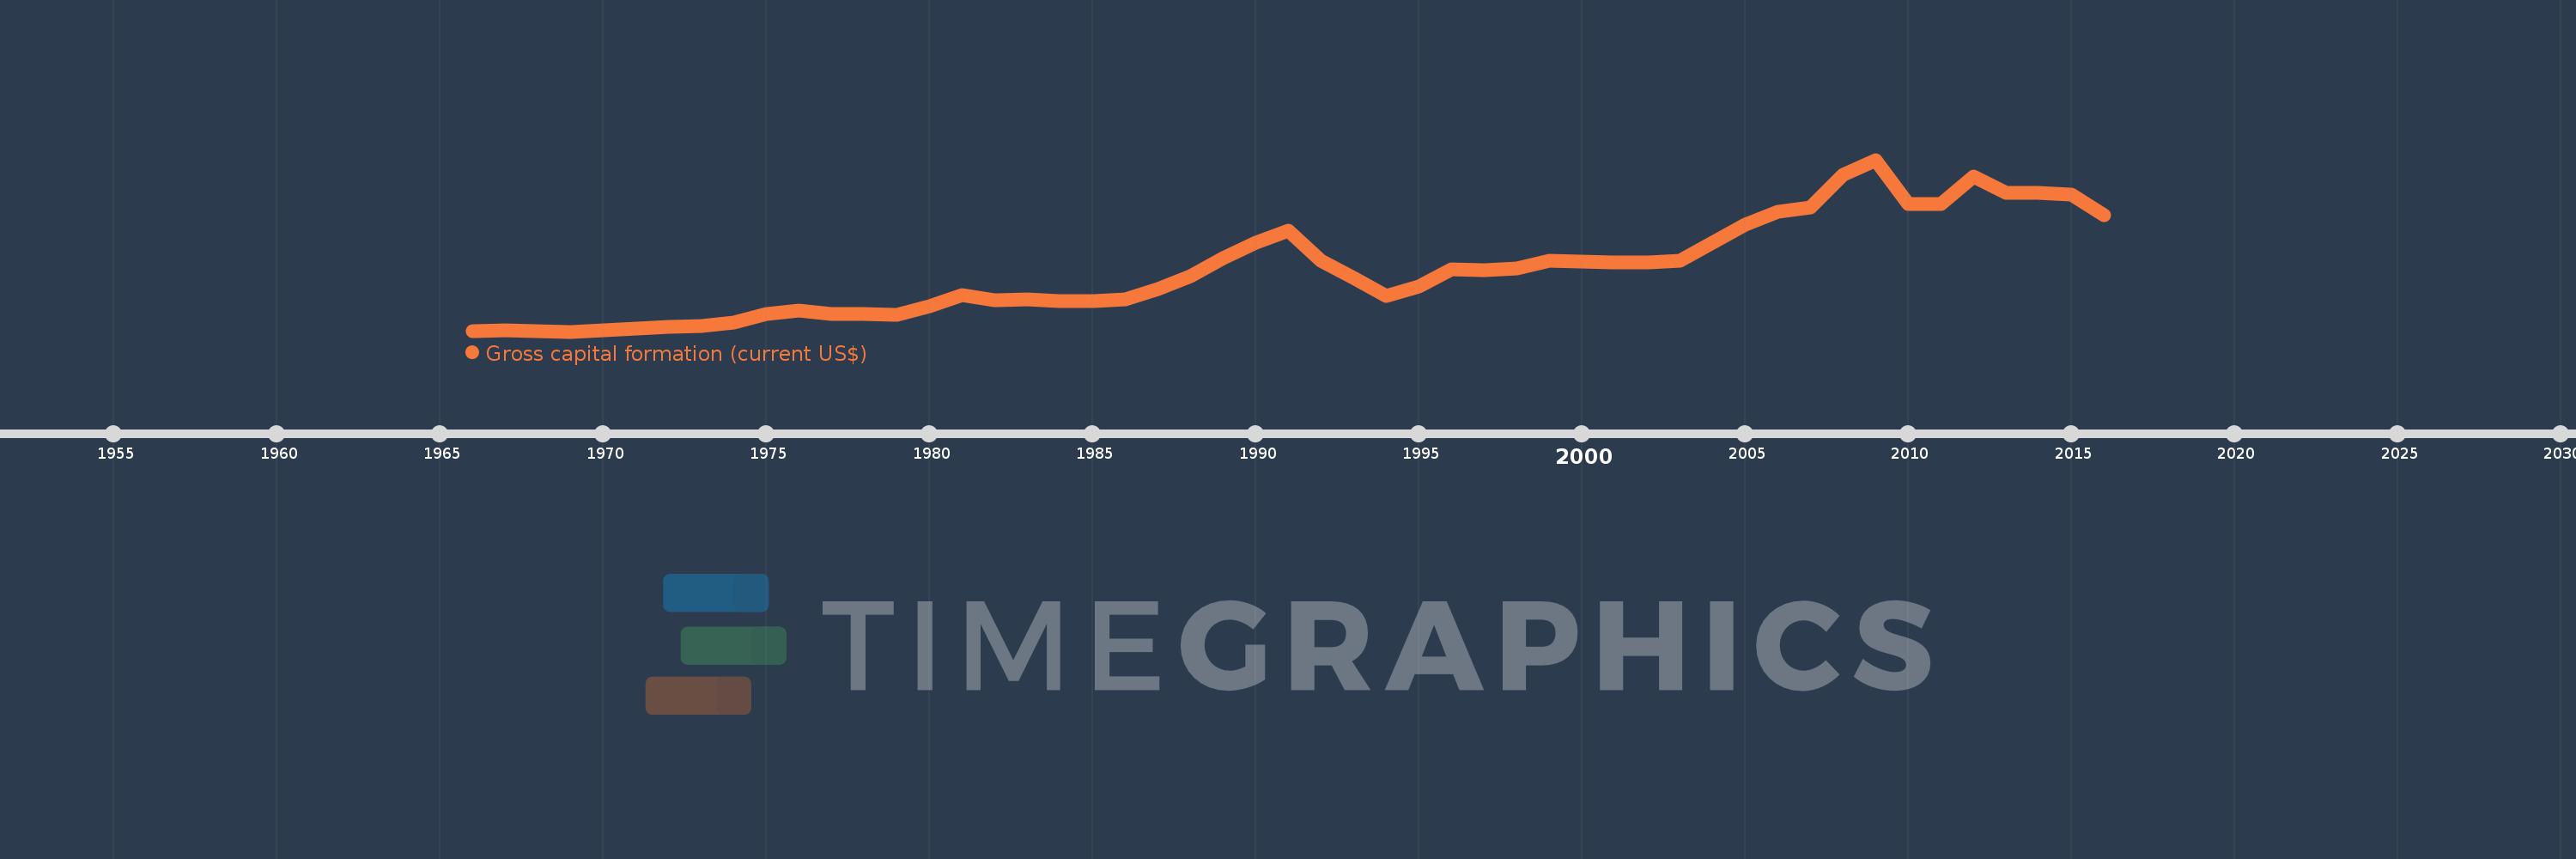
Gross capital formation (current US$)
2016,2015,2014,2013,2012,2011,2010,2009,2008,2007,2006,2005,2004,2003,2002,2001,2000,1999,1998,1997,1996,1995,1994,1993,1992,1991,1990,1989,1988,1987,1986,1985,1984,1983,1982,1981,1980,1979,1978,1977,1976,1975,1974,1973,1972,1971,1970,1969,1968,1967,1966
This statistics in other country:
AfghanistanAlbaniaAlgeriaAngolaAntigua and BarbudaArab WorldArgentinaArmeniaArubaAustraliaAustriaAzerbaijanBahamas, TheBahrainBangladeshBarbadosBelarusBelgiumBelizeBeninBermudaBhutanBoliviaBosnia and HerzegovinaBotswanaBrazilBrunei DarussalamBulgariaBurkina FasoBurundiCabo VerdeCambodiaCameroonCanadaCaribbean small statesCentral African RepublicCentral Europe and the BalticsChadChileChinaColombiaComorosCongo, Dem. Rep.Congo, Rep.Costa RicaCote d'IvoireCroatiaCubaCyprusCzech RepublicDenmarkDjiboutiDominicaDominican RepublicEarly-demographic dividendEast Asia & PacificEast Asia & Pacific (excluding high income)East Asia & Pacific (IDA & IBRD countries)EcuadorEgypt, Arab Rep.El SalvadorEquatorial GuineaEritreaEstoniaEthiopiaEuro areaEurope & Central AsiaEurope & Central Asia (excluding high income)Europe & Central Asia (IDA & IBRD countries)European UnionFaroe IslandsFijiFinlandFragile and conflict affected situationsFranceGabonGambia, TheGeorgiaGermanyGhanaGreeceGrenadaGuatemalaGuineaGuinea-BissauGuyanaHaitiHeavily indebted poor countries (HIPC)High incomeHondurasHong Kong SAR, ChinaHungaryIBRD onlyIcelandIDA & IBRD totalIDA blendIDA onlyIDA totalIndiaIndonesiaIran, Islamic Rep.IraqIrelandIsraelItalyJamaicaJapanJordanKazakhstanKenyaKiribatiKorea, Rep.KosovoKuwaitKyrgyz RepublicLao PDRLate-demographic dividendLatin America & Caribbean Latin America & Caribbean (excluding high income)Latin America & the Caribbean (IDA & IBRD countries)LatviaLeast developed countries: UN classificationLebanonLesothoLiberiaLibyaLithuaniaLow & middle incomeLow incomeLower middle incomeLuxembourgMacao SAR, ChinaMacedonia, FYRMadagascarMalawiMalaysiaMaldivesMaliMaltaMauritaniaMauritiusMexicoMicronesia, Fed. Sts.Middle East & North AfricaMiddle East & North Africa (excluding high income)Middle East & North Africa (IDA & IBRD countries)Middle incomeMoldovaMongoliaMontenegroMoroccoMozambiqueNamibiaNepalNetherlandsNew CaledoniaNew ZealandNicaraguaNigerNigeriaNorth AmericaNorwayOECD membersOmanOther small statesPakistanPanamaPapua New GuineaParaguayPeruPhilippinesPolandPortugalPost-demographic dividendPre-demographic dividendPuerto RicoQatarRomaniaRussian FederationRwandaSaudi ArabiaSenegalSerbiaSeychellesSierra LeoneSingaporeSlovak RepublicSloveniaSmall statesSolomon IslandsSouth AfricaSouth AsiaSouth Asia (IDA & IBRD)South SudanSpainSri LankaSt. Kitts and NevisSt. LuciaSt. Vincent and the GrenadinesSub-Saharan Africa Sub-Saharan Africa (excluding high income)Sub-Saharan Africa (IDA & IBRD countries)SudanSurinameSwazilandSwedenSwitzerlandSyrian Arab RepublicTajikistanTanzaniaThailandTimor-LesteTogoTongaTrinidad and TobagoTunisiaTurkeyTurkmenistanUgandaUkraineUnited Arab EmiratesUnited KingdomUnited StatesUpper middle incomeUruguayUzbekistanVanuatuVenezuela, RBVietnamWest Bank and GazaWorldYemen, Rep.ZambiaZimbabwe Timeline:
This timeline shows a graph from 1966 to 2016 of Finland. No data until 1965. Number of actual observations by date: 51.
Source name:
World Development Indicators
Source organization:
World Bank national accounts data, and OECD National Accounts data files.
Categories, topics:
Economy & Growth
Last updated:
apr 23, 2017
Indicators value changes by year
Minimum:
2.239 bln
jan 1, 1969
Maximum:
71.223 bln
jan 1, 2009
At the date of observation
Value
Absolute change
Change from previous value
jan 1, 1966
2.546 bln
+2.546 bln
0.0%
jan 1, 1967
2.586 bln
+40.306 mln
1.58%
jan 1, 1968
2.381 bln
-205.116 mln
-7.93%
jan 1, 1969
2.239 bln
-141.848 mln
-5.96%
jan 1, 1970
2.61 bln
+370.803 mln
16.56%
jan 1, 1971
3.614 bln
+1.005 bln
38.49%
jan 1, 1972
4.002 bln
+387.371 mln
10.72%
jan 1, 1973
4.337 bln
+335.008 mln
8.37%
jan 1, 1974
6.016 bln
+1.68 bln
38.73%
jan 1, 1975
9.201 bln
+3.185 bln
52.94%
jan 1, 1976
10.66 bln
+1.458 bln
15.85%
jan 1, 1977
9.309 bln
-1.351 bln
-12.67%
jan 1, 1978
9.376 bln
+66.967 mln
0.72%
jan 1, 1979
8.845 bln
-530.565 mln
-5.66%
jan 1, 1980
12.351 bln
+3.505 bln
39.63%
jan 1, 1981
16.763 bln
+4.412 bln
35.72%
jan 1, 1982
14.894 bln
-1.869 bln
-11.15%
jan 1, 1983
15.139 bln
+244.859 mln
1.64%
jan 1, 1984
14.474 bln
-665.029 mln
-4.39%
jan 1, 1985
14.4 bln
-73.266 mln
-0.51%
jan 1, 1986
15.056 bln
+655.166 mln
4.55%
jan 1, 1987
19.159 bln
+4.103 bln
27.25%
jan 1, 1988
24.549 bln
+5.39 bln
28.13%
jan 1, 1989
31.738 bln
+7.19 bln
29.29%
jan 1, 1990
38.081 bln
+6.342 bln
19.98%
jan 1, 1991
42.623 bln
+4.542 bln
11.93%
jan 1, 1992
30.781 bln
-11.842 bln
-27.78%
jan 1, 1993
23.71 bln
-7.071 bln
-22.97%
jan 1, 1994
16.577 bln
-7.132 bln
-30.08%
jan 1, 1995
20.41 bln
+3.832 bln
23.12%
jan 1, 1996
27.3 bln
+6.89 bln
33.76%
jan 1, 1997
26.741 bln
-558.962 mln
-2.05%
jan 1, 1998
27.607 bln
+866.501 mln
3.24%
jan 1, 1999
30.847 bln
+3.239 bln
11.73%
jan 1, 2000
30.293 bln
-553.695 mln
-1.79%
jan 1, 2001
29.996 bln
-296.675 mln
-0.98%
jan 1, 2002
29.993 bln
-3.474 mln
-0.01%
jan 1, 2003
30.811 bln
+818.377 mln
2.73%
jan 1, 2004
38.064 bln
+7.253 bln
23.54%
jan 1, 2005
45.077 bln
+7.013 bln
18.42%
jan 1, 2006
50.387 bln
+5.31 bln
11.78%
jan 1, 2007
52.02 bln
+1.633 bln
3.24%
jan 1, 2008
65.123 bln
+13.103 bln
25.19%
jan 1, 2009
71.223 bln
+6.1 bln
9.37%
jan 1, 2010
53.387 bln
-17.836 bln
-25.04%
jan 1, 2011
53.615 bln
+227.518 mln
0.43%
jan 1, 2012
64.334 bln
+10.72 bln
19.99%
jan 1, 2013
57.828 bln
-6.506 bln
-10.11%
jan 1, 2014
57.823 bln
-4.69 mln
-0.01%
jan 1, 2015
57.117 bln
-705.887 mln
-1.22%
jan 1, 2016
49.04 bln
-8.078 bln
-14.14%
Ranking of countries by current statistics by years


Comments: