29
/
en
AIzaSyAYiBZKx7MnpbEhh9jyipgxe19OcubqV5w
April 1, 2024
38189
IDA blend
IDB
false
2
1
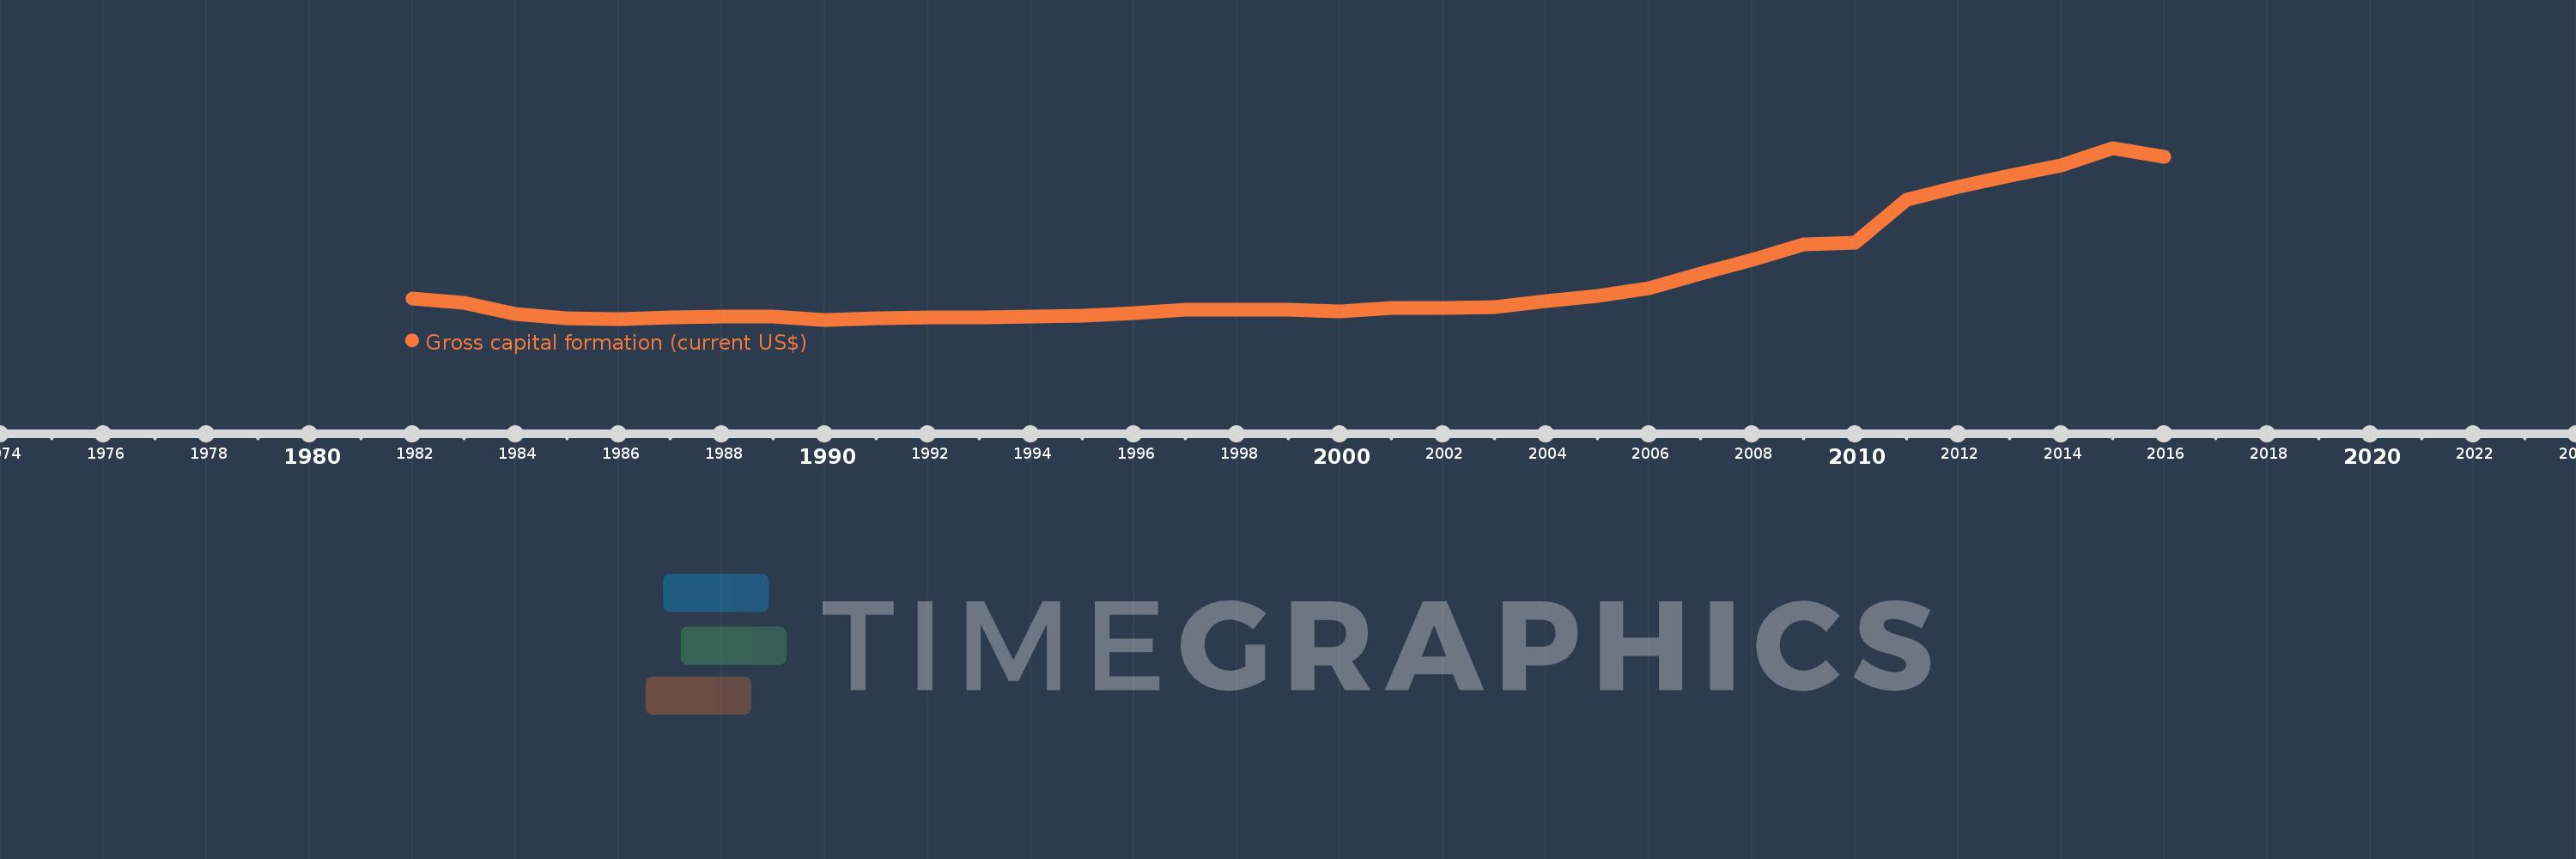
Gross capital formation (current US$)
2016,2015,2014,2013,2012,2011,2010,2009,2008,2007,2006,2005,2004,2003,2002,2001,2000,1999,1998,1997,1996,1995,1994,1993,1992,1991,1990,1989,1988,1987,1986,1985,1984,1983,1982
This statistics in other country:
AfghanistanAlbaniaAlgeriaAngolaAntigua and BarbudaArab WorldArgentinaArmeniaArubaAustraliaAustriaAzerbaijanBahamas, TheBahrainBangladeshBarbadosBelarusBelgiumBelizeBeninBermudaBhutanBoliviaBosnia and HerzegovinaBotswanaBrazilBrunei DarussalamBulgariaBurkina FasoBurundiCabo VerdeCambodiaCameroonCanadaCaribbean small statesCentral African RepublicCentral Europe and the BalticsChadChileChinaColombiaComorosCongo, Dem. Rep.Congo, Rep.Costa RicaCote d'IvoireCroatiaCubaCyprusCzech RepublicDenmarkDjiboutiDominicaDominican RepublicEarly-demographic dividendEast Asia & PacificEast Asia & Pacific (excluding high income)East Asia & Pacific (IDA & IBRD countries)EcuadorEgypt, Arab Rep.El SalvadorEquatorial GuineaEritreaEstoniaEthiopiaEuro areaEurope & Central AsiaEurope & Central Asia (excluding high income)Europe & Central Asia (IDA & IBRD countries)European UnionFaroe IslandsFijiFinlandFragile and conflict affected situationsFranceGabonGambia, TheGeorgiaGermanyGhanaGreeceGrenadaGuatemalaGuineaGuinea-BissauGuyanaHaitiHeavily indebted poor countries (HIPC)High incomeHondurasHong Kong SAR, ChinaHungaryIBRD onlyIcelandIDA & IBRD totalIDA blendIDA onlyIDA totalIndiaIndonesiaIran, Islamic Rep.IraqIrelandIsraelItalyJamaicaJapanJordanKazakhstanKenyaKiribatiKorea, Rep.KosovoKuwaitKyrgyz RepublicLao PDRLate-demographic dividendLatin America & Caribbean Latin America & Caribbean (excluding high income)Latin America & the Caribbean (IDA & IBRD countries)LatviaLeast developed countries: UN classificationLebanonLesothoLiberiaLibyaLithuaniaLow & middle incomeLow incomeLower middle incomeLuxembourgMacao SAR, ChinaMacedonia, FYRMadagascarMalawiMalaysiaMaldivesMaliMaltaMauritaniaMauritiusMexicoMicronesia, Fed. Sts.Middle East & North AfricaMiddle East & North Africa (excluding high income)Middle East & North Africa (IDA & IBRD countries)Middle incomeMoldovaMongoliaMontenegroMoroccoMozambiqueNamibiaNepalNetherlandsNew CaledoniaNew ZealandNicaraguaNigerNigeriaNorth AmericaNorwayOECD membersOmanOther small statesPakistanPanamaPapua New GuineaParaguayPeruPhilippinesPolandPortugalPost-demographic dividendPre-demographic dividendPuerto RicoQatarRomaniaRussian FederationRwandaSaudi ArabiaSenegalSerbiaSeychellesSierra LeoneSingaporeSlovak RepublicSloveniaSmall statesSolomon IslandsSouth AfricaSouth AsiaSouth Asia (IDA & IBRD)South SudanSpainSri LankaSt. Kitts and NevisSt. LuciaSt. Vincent and the GrenadinesSub-Saharan Africa Sub-Saharan Africa (excluding high income)Sub-Saharan Africa (IDA & IBRD countries)SudanSurinameSwazilandSwedenSwitzerlandSyrian Arab RepublicTajikistanTanzaniaThailandTimor-LesteTogoTongaTrinidad and TobagoTunisiaTurkeyTurkmenistanUgandaUkraineUnited Arab EmiratesUnited KingdomUnited StatesUpper middle incomeUruguayUzbekistanVanuatuVenezuela, RBVietnamWest Bank and GazaWorldYemen, Rep.ZambiaZimbabwe Timeline:
This timeline shows a graph from 1982 to 2016 of IDA blend. No data until 1981. Number of actual observations by date: 35.
Source name:
World Development Indicators
Source organization:
World Bank national accounts data, and OECD National Accounts data files.
Categories, topics:
Economy & Growth
Last updated:
apr 23, 2017
Indicators value changes by year
Minimum:
24.128 bln
jan 1, 1990
Maximum:
249.121 bln
jan 1, 2015
At the date of observation
Value
Absolute change
Change from previous value
jan 1, 1982
52.242 bln
+52.242 bln
0.0%
jan 1, 1983
45.748 bln
-6.494 bln
-12.43%
jan 1, 1984
31.98 bln
-13.768 bln
-30.1%
jan 1, 1985
26.31 bln
-5.669 bln
-17.73%
jan 1, 1986
25.31 bln
-1.0 bln
-3.8%
jan 1, 1987
26.894 bln
+1.584 bln
6.26%
jan 1, 1988
28.621 bln
+1.727 bln
6.42%
jan 1, 1989
28.362 bln
-259.721 mln
-0.91%
jan 1, 1990
24.128 bln
-4.233 bln
-14.93%
jan 1, 1991
25.696 bln
+1.568 bln
6.5%
jan 1, 1992
27.182 bln
+1.485 bln
5.78%
jan 1, 1993
27.537 bln
+355.756 mln
1.31%
jan 1, 1994
28.796 bln
+1.259 bln
4.57%
jan 1, 1995
29.222 bln
+425.987 mln
1.48%
jan 1, 1996
33.03 bln
+3.808 bln
13.03%
jan 1, 1997
36.95 bln
+3.92 bln
11.87%
jan 1, 1998
37.298 bln
+347.876 mln
0.94%
jan 1, 1999
37.431 bln
+132.498 mln
0.36%
jan 1, 2000
35.575 bln
-1.856 bln
-4.96%
jan 1, 2001
39.899 bln
+4.324 bln
12.15%
jan 1, 2002
39.054 bln
-844.382 mln
-2.12%
jan 1, 2003
40.291 bln
+1.236 bln
3.17%
jan 1, 2004
48.228 bln
+7.938 bln
19.7%
jan 1, 2005
54.943 bln
+6.714 bln
13.92%
jan 1, 2006
65.499 bln
+10.556 bln
19.21%
jan 1, 2007
84.052 bln
+18.553 bln
28.33%
jan 1, 2008
102.439 bln
+18.387 bln
21.88%
jan 1, 2009
122.597 bln
+20.158 bln
19.68%
jan 1, 2010
125.198 bln
+2.601 bln
2.12%
jan 1, 2011
181.316 bln
+56.118 bln
44.82%
jan 1, 2012
198.45 bln
+17.135 bln
9.45%
jan 1, 2013
212.256 bln
+13.805 bln
6.96%
jan 1, 2014
226.471 bln
+14.215 bln
6.7%
jan 1, 2015
249.121 bln
+22.65 bln
10.0%
jan 1, 2016
237.837 bln
-11.284 bln
-4.53%
Ranking of countries by current statistics by years


Comments: