29
/
en
AIzaSyAYiBZKx7MnpbEhh9jyipgxe19OcubqV5w
April 1, 2024
210416
Nicaragua
NIC
true
2
1
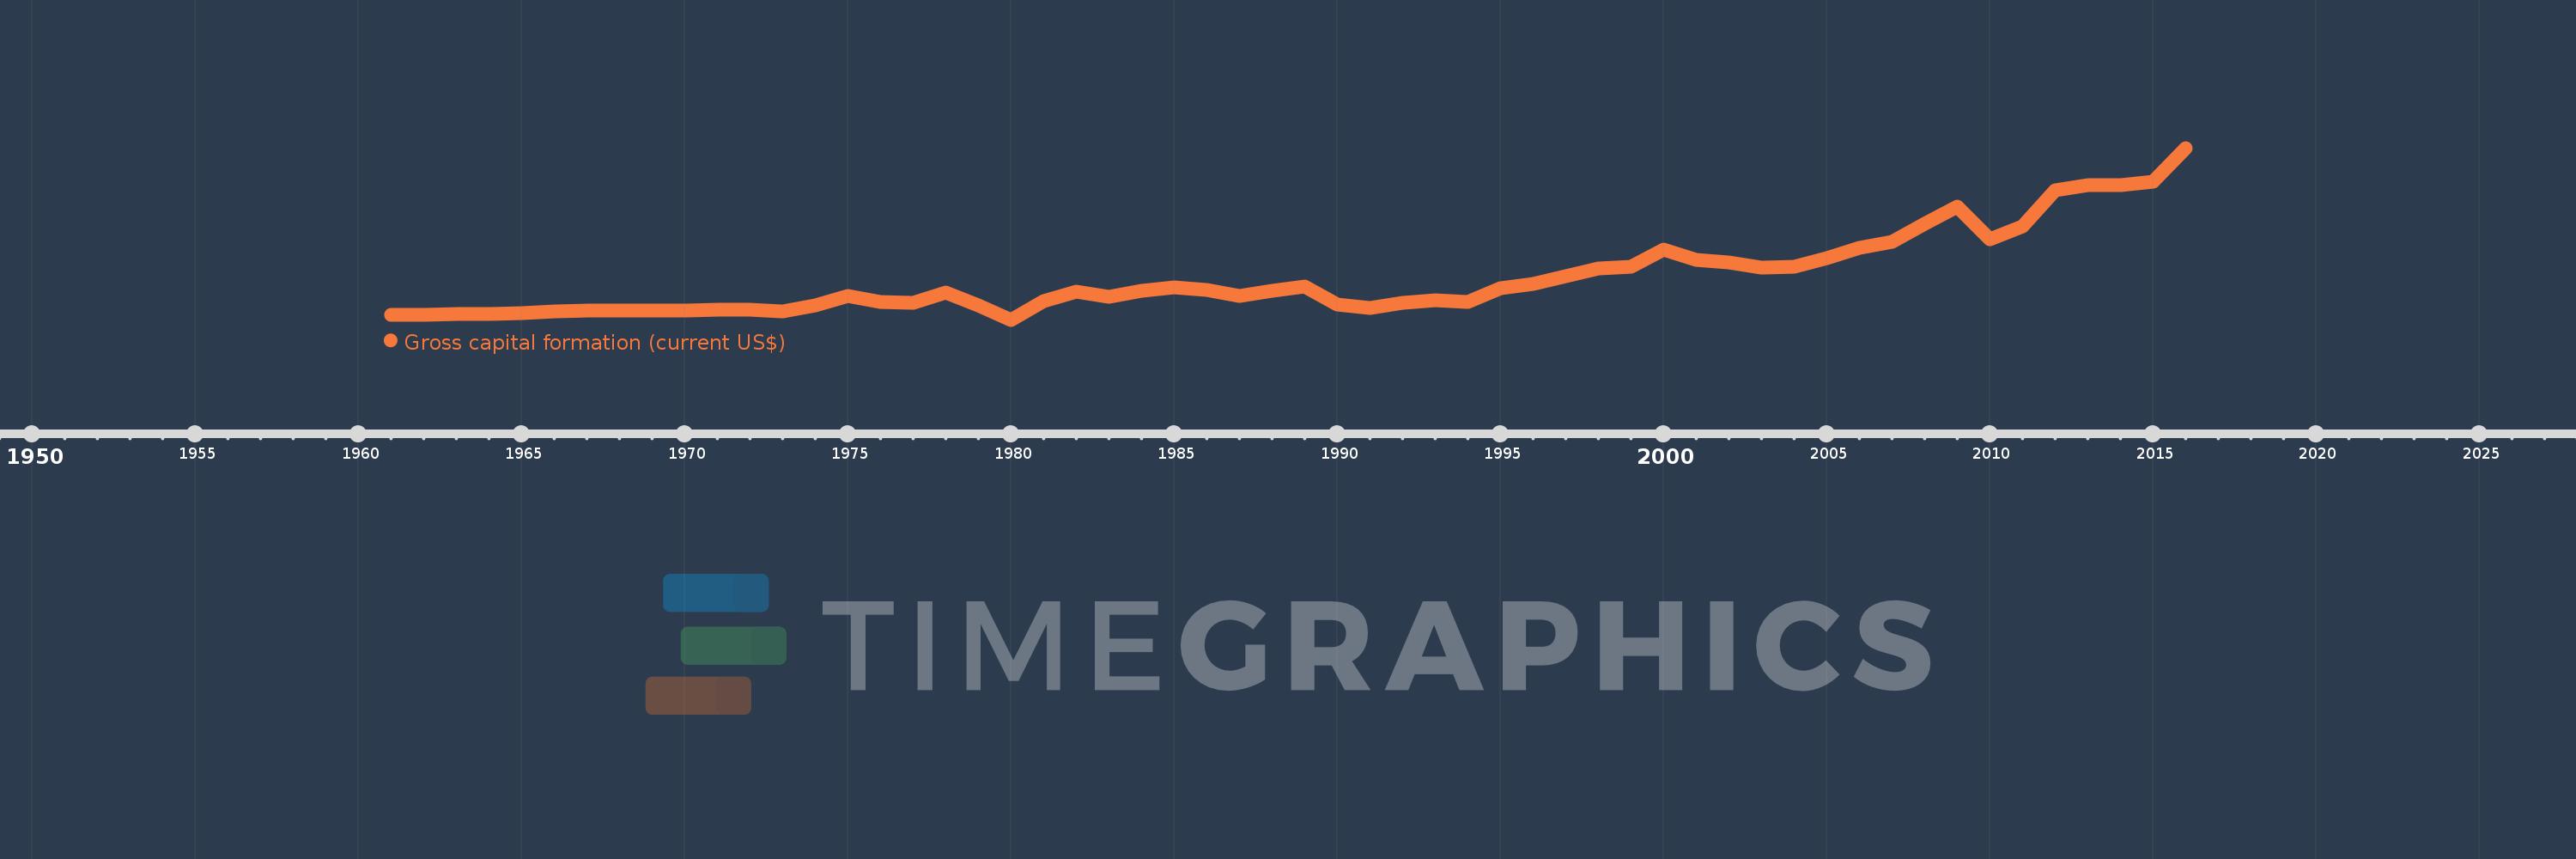
Gross capital formation (current US$)
2016,2015,2014,2013,2012,2011,2010,2009,2008,2007,2006,2005,2004,2003,2002,2001,2000,1999,1998,1997,1996,1995,1994,1993,1992,1991,1990,1989,1988,1987,1986,1985,1984,1983,1982,1981,1980,1979,1978,1977,1976,1975,1974,1973,1972,1971,1970,1969,1968,1967,1966,1965,1964,1963,1962,1961
This statistics in other country:
AfghanistanAlbaniaAlgeriaAngolaAntigua and BarbudaArab WorldArgentinaArmeniaArubaAustraliaAustriaAzerbaijanBahamas, TheBahrainBangladeshBarbadosBelarusBelgiumBelizeBeninBermudaBhutanBoliviaBosnia and HerzegovinaBotswanaBrazilBrunei DarussalamBulgariaBurkina FasoBurundiCabo VerdeCambodiaCameroonCanadaCaribbean small statesCentral African RepublicCentral Europe and the BalticsChadChileChinaColombiaComorosCongo, Dem. Rep.Congo, Rep.Costa RicaCote d'IvoireCroatiaCubaCyprusCzech RepublicDenmarkDjiboutiDominicaDominican RepublicEarly-demographic dividendEast Asia & PacificEast Asia & Pacific (excluding high income)East Asia & Pacific (IDA & IBRD countries)EcuadorEgypt, Arab Rep.El SalvadorEquatorial GuineaEritreaEstoniaEthiopiaEuro areaEurope & Central AsiaEurope & Central Asia (excluding high income)Europe & Central Asia (IDA & IBRD countries)European UnionFaroe IslandsFijiFinlandFragile and conflict affected situationsFranceGabonGambia, TheGeorgiaGermanyGhanaGreeceGrenadaGuatemalaGuineaGuinea-BissauGuyanaHaitiHeavily indebted poor countries (HIPC)High incomeHondurasHong Kong SAR, ChinaHungaryIBRD onlyIcelandIDA & IBRD totalIDA blendIDA onlyIDA totalIndiaIndonesiaIran, Islamic Rep.IraqIrelandIsraelItalyJamaicaJapanJordanKazakhstanKenyaKiribatiKorea, Rep.KosovoKuwaitKyrgyz RepublicLao PDRLate-demographic dividendLatin America & Caribbean Latin America & Caribbean (excluding high income)Latin America & the Caribbean (IDA & IBRD countries)LatviaLeast developed countries: UN classificationLebanonLesothoLiberiaLibyaLithuaniaLow & middle incomeLow incomeLower middle incomeLuxembourgMacao SAR, ChinaMacedonia, FYRMadagascarMalawiMalaysiaMaldivesMaliMaltaMauritaniaMauritiusMexicoMicronesia, Fed. Sts.Middle East & North AfricaMiddle East & North Africa (excluding high income)Middle East & North Africa (IDA & IBRD countries)Middle incomeMoldovaMongoliaMontenegroMoroccoMozambiqueNamibiaNepalNetherlandsNew CaledoniaNew ZealandNicaraguaNigerNigeriaNorth AmericaNorwayOECD membersOmanOther small statesPakistanPanamaPapua New GuineaParaguayPeruPhilippinesPolandPortugalPost-demographic dividendPre-demographic dividendPuerto RicoQatarRomaniaRussian FederationRwandaSaudi ArabiaSenegalSerbiaSeychellesSierra LeoneSingaporeSlovak RepublicSloveniaSmall statesSolomon IslandsSouth AfricaSouth AsiaSouth Asia (IDA & IBRD)South SudanSpainSri LankaSt. Kitts and NevisSt. LuciaSt. Vincent and the GrenadinesSub-Saharan Africa Sub-Saharan Africa (excluding high income)Sub-Saharan Africa (IDA & IBRD countries)SudanSurinameSwazilandSwedenSwitzerlandSyrian Arab RepublicTajikistanTanzaniaThailandTimor-LesteTogoTongaTrinidad and TobagoTunisiaTurkeyTurkmenistanUgandaUkraineUnited Arab EmiratesUnited KingdomUnited StatesUpper middle incomeUruguayUzbekistanVanuatuVenezuela, RBVietnamWest Bank and GazaWorldYemen, Rep.ZambiaZimbabwe Timeline:
This timeline shows a graph from 1961 to 2016 of Nicaragua. No data until 1960. Number of actual observations by date: 56.
Source name:
World Development Indicators
Source organization:
World Bank national accounts data, and OECD National Accounts data files.
Categories, topics:
Economy & Growth
Last updated:
apr 23, 2017
Indicators value changes by year
Minimum:
-87.695 mln
jan 1, 1980
Maximum:
4.044 bln
jan 1, 2016
At the date of observation
Value
Absolute change
Change from previous value
jan 1, 1961
33.317 mln
+33.317 mln
0.0%
jan 1, 1962
35.697 mln
+2.38 mln
7.14%
jan 1, 1963
45.692 mln
+9.995 mln
28.0%
jan 1, 1964
50.928 mln
+5.236 mln
11.46%
jan 1, 1965
67.111 mln
+16.183 mln
31.78%
jan 1, 1966
118.514 mln
+51.404 mln
76.6%
jan 1, 1967
139.471 mln
+20.957 mln
17.68%
jan 1, 1968
137.957 mln
-1.514 mln
-1.09%
jan 1, 1969
123.429 mln
-14.529 mln
-10.53%
jan 1, 1970
141.886 mln
+18.457 mln
14.95%
jan 1, 1971
144.4 mln
+2.514 mln
1.77%
jan 1, 1972
146.429 mln
+2.029 mln
1.4%
jan 1, 1973
113.171 mln
-33.257 mln
-22.71%
jan 1, 1974
262.257 mln
+149.086 mln
131.73%
jan 1, 1975
479.043 mln
+216.786 mln
82.66%
jan 1, 1976
340.657 mln
-138.386 mln
-28.89%
jan 1, 1977
320.071 mln
-20.586 mln
-6.04%
jan 1, 1978
573.971 mln
+253.9 mln
79.33%
jan 1, 1979
264.329 mln
-309.643 mln
-53.95%
jan 1, 1980
-87.695 mln
-352.023 mln
-133.18%
jan 1, 1981
367.347 mln
+455.042 mln
-518.89%
jan 1, 1982
577.65 mln
+210.303 mln
57.25%
jan 1, 1983
462.896 mln
-114.754 mln
-19.87%
jan 1, 1984
616.75 mln
+153.854 mln
33.24%
jan 1, 1985
690.31 mln
+73.56 mln
11.93%
jan 1, 1986
620.998 mln
-69.313 mln
-10.04%
jan 1, 1987
487.477 mln
-133.521 mln
-21.5%
jan 1, 1988
608.441 mln
+120.965 mln
24.81%
jan 1, 1989
703.795 mln
+95.353 mln
15.67%
jan 1, 1990
278.238 mln
-425.557 mln
-60.47%
jan 1, 1991
194.581 mln
-83.657 mln
-30.07%
jan 1, 1992
309.32 mln
+114.739 mln
58.97%
jan 1, 1993
375.14 mln
+65.82 mln
21.28%
jan 1, 1994
341.912 mln
-33.228 mln
-8.86%
jan 1, 1995
677.267 mln
+335.356 mln
98.08%
jan 1, 1996
783.753 mln
+106.486 mln
15.72%
jan 1, 1997
955.455 mln
+171.702 mln
21.91%
jan 1, 1998
1.154 bln
+198.474 mln
20.77%
jan 1, 1999
1.197 bln
+43.103 mln
3.74%
jan 1, 2000
1.603 bln
+405.486 mln
33.87%
jan 1, 2001
1.361 bln
-241.171 mln
-15.05%
jan 1, 2002
1.294 bln
-67.454 mln
-4.95%
jan 1, 2003
1.172 bln
-121.981 mln
-9.43%
jan 1, 2004
1.184 bln
+12.362 mln
1.05%
jan 1, 2005
1.397 bln
+213.096 mln
17.99%
jan 1, 2006
1.636 bln
+238.922 mln
17.1%
jan 1, 2007
1.796 bln
+159.649 mln
9.76%
jan 1, 2008
2.214 bln
+418.015 mln
23.28%
jan 1, 2009
2.638 bln
+423.58 mln
19.13%
jan 1, 2010
1.841 bln
-796.349 mln
-30.19%
jan 1, 2011
2.149 bln
+307.867 mln
16.72%
jan 1, 2012
3.02 bln
+870.693 mln
40.52%
jan 1, 2013
3.151 bln
+130.978 mln
4.34%
jan 1, 2014
3.142 bln
-8.963 mln
-0.28%
jan 1, 2015
3.234 bln
+91.976 mln
2.93%
jan 1, 2016
4.044 bln
+810.362 mln
25.06%
Ranking of countries by current statistics by years


Comments: