29
/
en
AIzaSyAYiBZKx7MnpbEhh9jyipgxe19OcubqV5w
April 1, 2024
209362
New Zealand
NZL
true
2
1
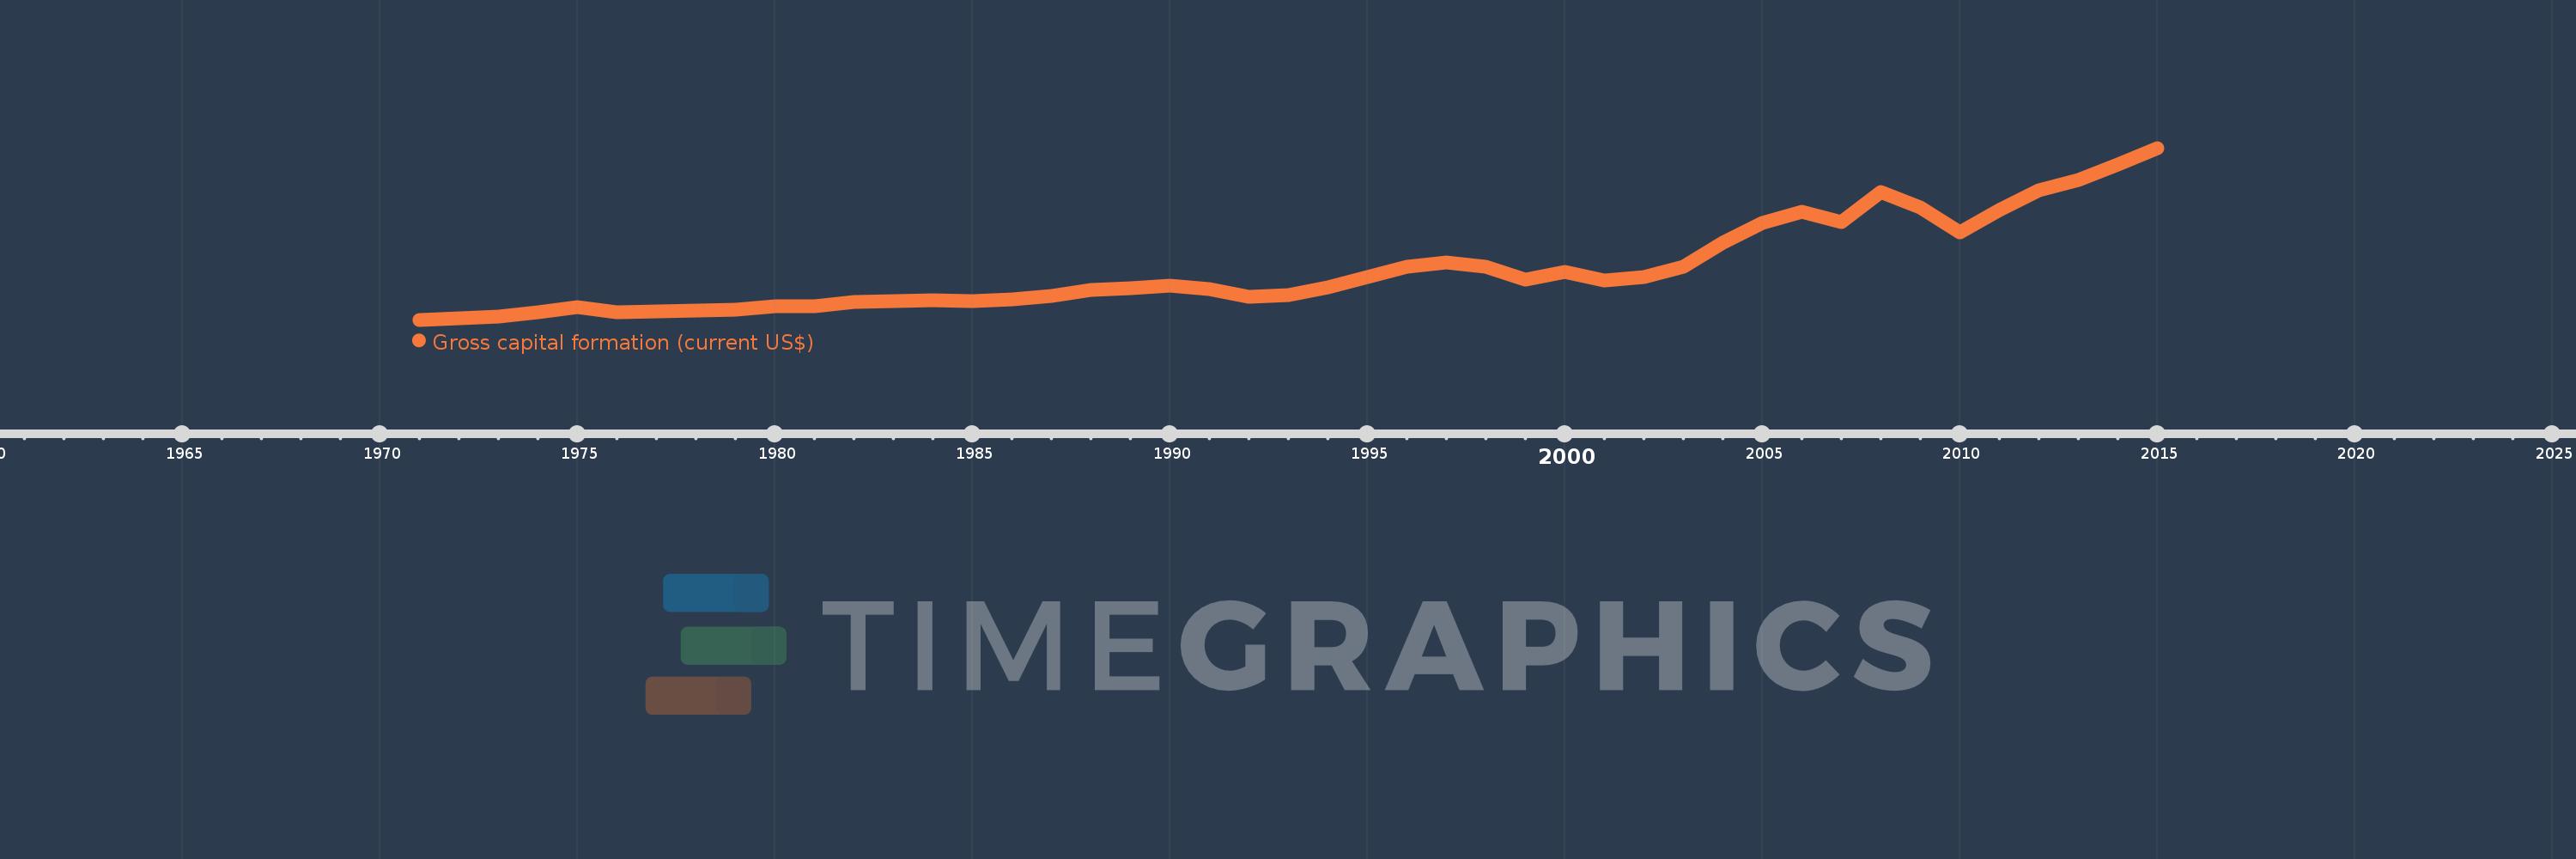
Gross capital formation (current US$)
2015,2014,2013,2012,2011,2010,2009,2008,2007,2006,2005,2004,2003,2002,2001,2000,1999,1998,1997,1996,1995,1994,1993,1992,1991,1990,1989,1988,1987,1986,1985,1984,1983,1982,1981,1980,1979,1978,1977,1976,1975,1974,1973,1972,1971
This statistics in other country:
AfghanistanAlbaniaAlgeriaAngolaAntigua and BarbudaArab WorldArgentinaArmeniaArubaAustraliaAustriaAzerbaijanBahamas, TheBahrainBangladeshBarbadosBelarusBelgiumBelizeBeninBermudaBhutanBoliviaBosnia and HerzegovinaBotswanaBrazilBrunei DarussalamBulgariaBurkina FasoBurundiCabo VerdeCambodiaCameroonCanadaCaribbean small statesCentral African RepublicCentral Europe and the BalticsChadChileChinaColombiaComorosCongo, Dem. Rep.Congo, Rep.Costa RicaCote d'IvoireCroatiaCubaCyprusCzech RepublicDenmarkDjiboutiDominicaDominican RepublicEarly-demographic dividendEast Asia & PacificEast Asia & Pacific (excluding high income)East Asia & Pacific (IDA & IBRD countries)EcuadorEgypt, Arab Rep.El SalvadorEquatorial GuineaEritreaEstoniaEthiopiaEuro areaEurope & Central AsiaEurope & Central Asia (excluding high income)Europe & Central Asia (IDA & IBRD countries)European UnionFaroe IslandsFijiFinlandFragile and conflict affected situationsFranceGabonGambia, TheGeorgiaGermanyGhanaGreeceGrenadaGuatemalaGuineaGuinea-BissauGuyanaHaitiHeavily indebted poor countries (HIPC)High incomeHondurasHong Kong SAR, ChinaHungaryIBRD onlyIcelandIDA & IBRD totalIDA blendIDA onlyIDA totalIndiaIndonesiaIran, Islamic Rep.IraqIrelandIsraelItalyJamaicaJapanJordanKazakhstanKenyaKiribatiKorea, Rep.KosovoKuwaitKyrgyz RepublicLao PDRLate-demographic dividendLatin America & Caribbean Latin America & Caribbean (excluding high income)Latin America & the Caribbean (IDA & IBRD countries)LatviaLeast developed countries: UN classificationLebanonLesothoLiberiaLibyaLithuaniaLow & middle incomeLow incomeLower middle incomeLuxembourgMacao SAR, ChinaMacedonia, FYRMadagascarMalawiMalaysiaMaldivesMaliMaltaMauritaniaMauritiusMexicoMicronesia, Fed. Sts.Middle East & North AfricaMiddle East & North Africa (excluding high income)Middle East & North Africa (IDA & IBRD countries)Middle incomeMoldovaMongoliaMontenegroMoroccoMozambiqueNamibiaNepalNetherlandsNew CaledoniaNew ZealandNicaraguaNigerNigeriaNorth AmericaNorwayOECD membersOmanOther small statesPakistanPanamaPapua New GuineaParaguayPeruPhilippinesPolandPortugalPost-demographic dividendPre-demographic dividendPuerto RicoQatarRomaniaRussian FederationRwandaSaudi ArabiaSenegalSerbiaSeychellesSierra LeoneSingaporeSlovak RepublicSloveniaSmall statesSolomon IslandsSouth AfricaSouth AsiaSouth Asia (IDA & IBRD)South SudanSpainSri LankaSt. Kitts and NevisSt. LuciaSt. Vincent and the GrenadinesSub-Saharan Africa Sub-Saharan Africa (excluding high income)Sub-Saharan Africa (IDA & IBRD countries)SudanSurinameSwazilandSwedenSwitzerlandSyrian Arab RepublicTajikistanTanzaniaThailandTimor-LesteTogoTongaTrinidad and TobagoTunisiaTurkeyTurkmenistanUgandaUkraineUnited Arab EmiratesUnited KingdomUnited StatesUpper middle incomeUruguayUzbekistanVanuatuVenezuela, RBVietnamWest Bank and GazaWorldYemen, Rep.ZambiaZimbabwe Timeline:
This timeline shows a graph from 1971 to 2015 of New Zealand. No data until 1970. Number of actual observations by date: 45.
Source name:
World Development Indicators
Source organization:
World Bank national accounts data, and OECD National Accounts data files.
Categories, topics:
Economy & Growth
Last updated:
apr 23, 2017
Indicators value changes by year
Minimum:
1.58 bln
jan 1, 1971
Maximum:
45.318 bln
jan 1, 2015
At the date of observation
Value
Absolute change
Change from previous value
jan 1, 1971
1.58 bln
+1.58 bln
0.0%
jan 1, 1972
1.934 bln
+354.706 mln
22.46%
jan 1, 1973
2.287 bln
+353.093 mln
18.26%
jan 1, 1974
3.484 bln
+1.197 bln
52.32%
jan 1, 1975
4.88 bln
+1.396 bln
40.07%
jan 1, 1976
3.56 bln
-1.32 bln
-27.05%
jan 1, 1977
3.718 bln
+157.876 mln
4.43%
jan 1, 1978
3.9 bln
+182.615 mln
4.91%
jan 1, 1979
4.108 bln
+208.023 mln
5.33%
jan 1, 1980
4.904 bln
+795.851 mln
19.37%
jan 1, 1981
5.004 bln
+99.523 mln
2.03%
jan 1, 1982
6.169 bln
+1.165 bln
23.29%
jan 1, 1983
6.398 bln
+229.053 mln
3.71%
jan 1, 1984
6.527 bln
+128.942 mln
2.02%
jan 1, 1985
6.287 bln
-240.396 mln
-3.68%
jan 1, 1986
6.671 bln
+384.156 mln
6.11%
jan 1, 1987
7.684 bln
+1.013 bln
15.19%
jan 1, 1988
9.138 bln
+1.453 bln
18.91%
jan 1, 1989
9.528 bln
+390.13 mln
4.27%
jan 1, 1990
10.265 bln
+736.686 mln
7.73%
jan 1, 1991
9.313 bln
-951.211 mln
-9.27%
jan 1, 1992
7.499 bln
-1.814 bln
-19.48%
jan 1, 1993
7.774 bln
+274.914 mln
3.67%
jan 1, 1994
9.928 bln
+2.154 bln
27.7%
jan 1, 1995
12.491 bln
+2.563 bln
25.81%
jan 1, 1996
15.119 bln
+2.628 bln
21.04%
jan 1, 1997
16.234 bln
+1.115 bln
7.38%
jan 1, 1998
15.15 bln
-1.084 bln
-6.68%
jan 1, 1999
11.702 bln
-3.449 bln
-22.76%
jan 1, 2000
13.652 bln
+1.95 bln
16.67%
jan 1, 2001
11.595 bln
-2.057 bln
-15.06%
jan 1, 2002
12.365 bln
+769.498 mln
6.64%
jan 1, 2003
15.156 bln
+2.791 bln
22.57%
jan 1, 2004
21.294 bln
+6.138 bln
40.5%
jan 1, 2005
26.269 bln
+4.975 bln
23.37%
jan 1, 2006
29.163 bln
+2.894 bln
11.02%
jan 1, 2007
26.501 bln
-2.662 bln
-9.13%
jan 1, 2008
33.99 bln
+7.489 bln
28.26%
jan 1, 2009
30.226 bln
-3.764 bln
-11.07%
jan 1, 2010
23.853 bln
-6.373 bln
-21.09%
jan 1, 2011
29.438 bln
+5.585 bln
23.41%
jan 1, 2012
34.44 bln
+5.002 bln
16.99%
jan 1, 2013
37.117 bln
+2.677 bln
7.77%
jan 1, 2014
41.157 bln
+4.04 bln
10.88%
jan 1, 2015
45.318 bln
+4.161 bln
10.11%
Ranking of countries by current statistics by years


Comments: