29
/
en
AIzaSyAYiBZKx7MnpbEhh9jyipgxe19OcubqV5w
April 1, 2024
112295
Costa Rica
CRI
true
2
1
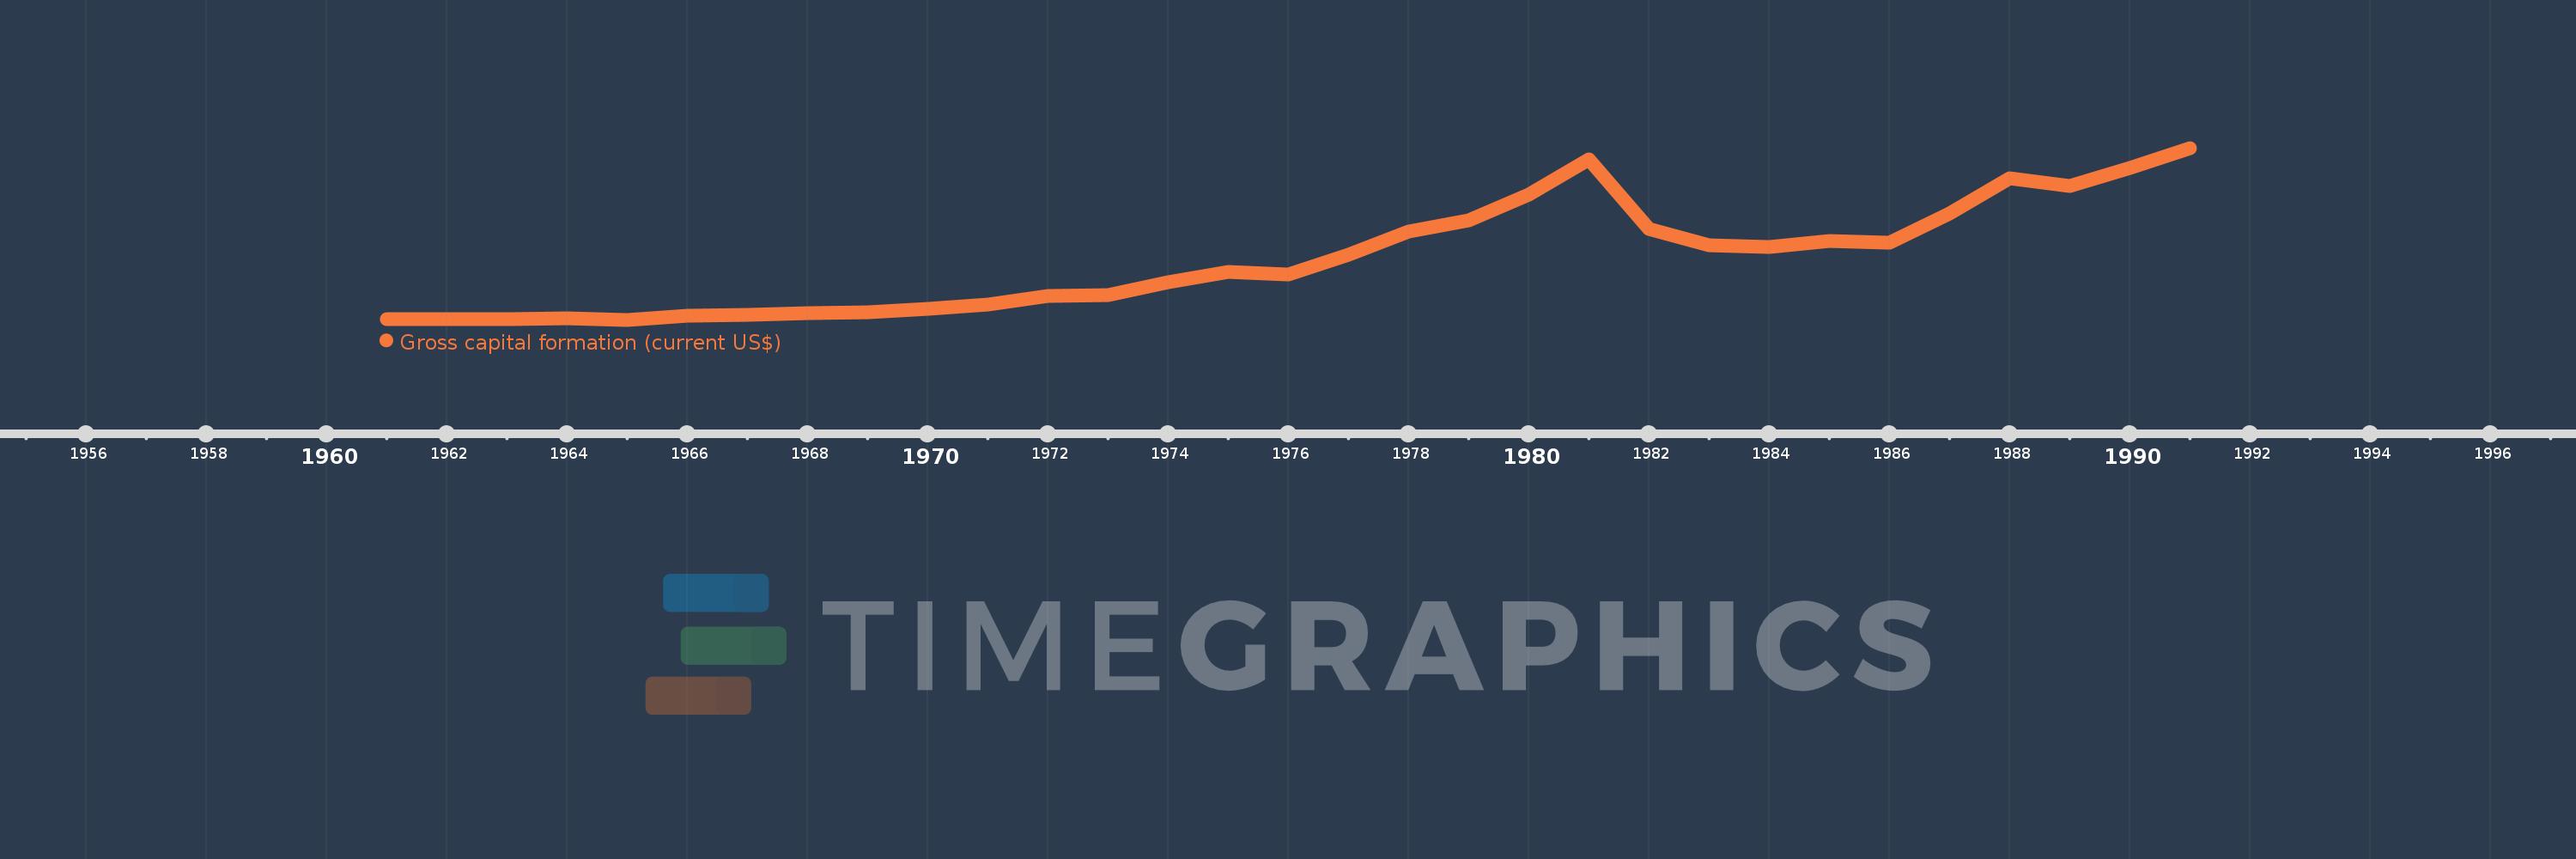
Gross capital formation (current US$)
1991,1990,1989,1988,1987,1986,1985,1984,1983,1982,1981,1980,1979,1978,1977,1976,1975,1974,1973,1972,1971,1970,1969,1968,1967,1966,1965,1964,1963,1962,1961
This statistics in other country:
AfghanistanAlbaniaAlgeriaAngolaAntigua and BarbudaArab WorldArgentinaArmeniaArubaAustraliaAustriaAzerbaijanBahamas, TheBahrainBangladeshBarbadosBelarusBelgiumBelizeBeninBermudaBhutanBoliviaBosnia and HerzegovinaBotswanaBrazilBrunei DarussalamBulgariaBurkina FasoBurundiCabo VerdeCambodiaCameroonCanadaCaribbean small statesCentral African RepublicCentral Europe and the BalticsChadChileChinaColombiaComorosCongo, Dem. Rep.Congo, Rep.Costa RicaCote d'IvoireCroatiaCubaCyprusCzech RepublicDenmarkDjiboutiDominicaDominican RepublicEarly-demographic dividendEast Asia & PacificEast Asia & Pacific (excluding high income)East Asia & Pacific (IDA & IBRD countries)EcuadorEgypt, Arab Rep.El SalvadorEquatorial GuineaEritreaEstoniaEthiopiaEuro areaEurope & Central AsiaEurope & Central Asia (excluding high income)Europe & Central Asia (IDA & IBRD countries)European UnionFaroe IslandsFijiFinlandFragile and conflict affected situationsFranceGabonGambia, TheGeorgiaGermanyGhanaGreeceGrenadaGuatemalaGuineaGuinea-BissauGuyanaHaitiHeavily indebted poor countries (HIPC)High incomeHondurasHong Kong SAR, ChinaHungaryIBRD onlyIcelandIDA & IBRD totalIDA blendIDA onlyIDA totalIndiaIndonesiaIran, Islamic Rep.IraqIrelandIsraelItalyJamaicaJapanJordanKazakhstanKenyaKiribatiKorea, Rep.KosovoKuwaitKyrgyz RepublicLao PDRLate-demographic dividendLatin America & Caribbean Latin America & Caribbean (excluding high income)Latin America & the Caribbean (IDA & IBRD countries)LatviaLeast developed countries: UN classificationLebanonLesothoLiberiaLibyaLithuaniaLow & middle incomeLow incomeLower middle incomeLuxembourgMacao SAR, ChinaMacedonia, FYRMadagascarMalawiMalaysiaMaldivesMaliMaltaMauritaniaMauritiusMexicoMicronesia, Fed. Sts.Middle East & North AfricaMiddle East & North Africa (excluding high income)Middle East & North Africa (IDA & IBRD countries)Middle incomeMoldovaMongoliaMontenegroMoroccoMozambiqueNamibiaNepalNetherlandsNew CaledoniaNew ZealandNicaraguaNigerNigeriaNorth AmericaNorwayOECD membersOmanOther small statesPakistanPanamaPapua New GuineaParaguayPeruPhilippinesPolandPortugalPost-demographic dividendPre-demographic dividendPuerto RicoQatarRomaniaRussian FederationRwandaSaudi ArabiaSenegalSerbiaSeychellesSierra LeoneSingaporeSlovak RepublicSloveniaSmall statesSolomon IslandsSouth AfricaSouth AsiaSouth Asia (IDA & IBRD)South SudanSpainSri LankaSt. Kitts and NevisSt. LuciaSt. Vincent and the GrenadinesSub-Saharan Africa Sub-Saharan Africa (excluding high income)Sub-Saharan Africa (IDA & IBRD countries)SudanSurinameSwazilandSwedenSwitzerlandSyrian Arab RepublicTajikistanTanzaniaThailandTimor-LesteTogoTongaTrinidad and TobagoTunisiaTurkeyTurkmenistanUgandaUkraineUnited Arab EmiratesUnited KingdomUnited StatesUpper middle incomeUruguayUzbekistanVanuatuVenezuela, RBVietnamWest Bank and GazaWorldYemen, Rep.ZambiaZimbabwe Timeline:
This timeline shows a graph from 1961 to 1991 of Costa Rica. No data until 1960. Number of actual observations by date: 31.
Source name:
World Development Indicators
Source organization:
World Bank national accounts data, and OECD National Accounts data files.
Categories, topics:
Economy & Growth
Last updated:
apr 23, 2017
Indicators value changes by year
Minimum:
86.781 mln
jan 1, 1965
Maximum:
1.368 bln
jan 1, 1991
At the date of observation
Value
Absolute change
Change from previous value
jan 1, 1961
88.817 mln
+88.817 mln
0.0%
jan 1, 1962
92.565 mln
+3.748 mln
4.22%
jan 1, 1963
93.217 mln
+651.979K
0.7%
jan 1, 1964
96.209 mln
+2.992 mln
3.21%
jan 1, 1965
86.781 mln
-9.428 mln
-9.8%
jan 1, 1966
115.653 mln
+28.872 mln
33.27%
jan 1, 1967
123.366 mln
+7.713 mln
6.67%
jan 1, 1968
135.396 mln
+12.03 mln
9.75%
jan 1, 1969
139.502 mln
+4.106 mln
3.03%
jan 1, 1970
170.974 mln
+31.472 mln
22.56%
jan 1, 1971
202.249 mln
+31.275 mln
18.29%
jan 1, 1972
262.142 mln
+59.893 mln
29.61%
jan 1, 1973
272.751 mln
+10.609 mln
4.05%
jan 1, 1974
366.838 mln
+94.088 mln
34.5%
jan 1, 1975
445.612 mln
+78.773 mln
21.47%
jan 1, 1976
424.352 mln
-21.259 mln
-4.77%
jan 1, 1977
570.863 mln
+146.511 mln
34.53%
jan 1, 1978
745.671 mln
+174.807 mln
30.62%
jan 1, 1979
826.593 mln
+80.922 mln
10.85%
jan 1, 1980
1.022 bln
+194.959 mln
23.59%
jan 1, 1981
1.284 bln
+262.392 mln
25.69%
jan 1, 1982
761.603 mln
-522.341 mln
-40.68%
jan 1, 1983
643.473 mln
-118.13 mln
-15.51%
jan 1, 1984
631.554 mln
-11.919 mln
-1.85%
jan 1, 1985
675.34 mln
+43.785 mln
6.93%
jan 1, 1986
659.604 mln
-15.736 mln
-2.33%
jan 1, 1987
880.352 mln
+220.749 mln
33.47%
jan 1, 1988
1.141 bln
+260.745 mln
29.62%
jan 1, 1989
1.087 bln
-54.346 mln
-4.76%
jan 1, 1990
1.218 bln
+131.553 mln
12.11%
jan 1, 1991
1.368 bln
+149.71 mln
12.29%
Ranking of countries by current statistics by years


Comments: