29
/
en
AIzaSyAYiBZKx7MnpbEhh9jyipgxe19OcubqV5w
April 1, 2024
64759
Albania
ALB
true
2
1
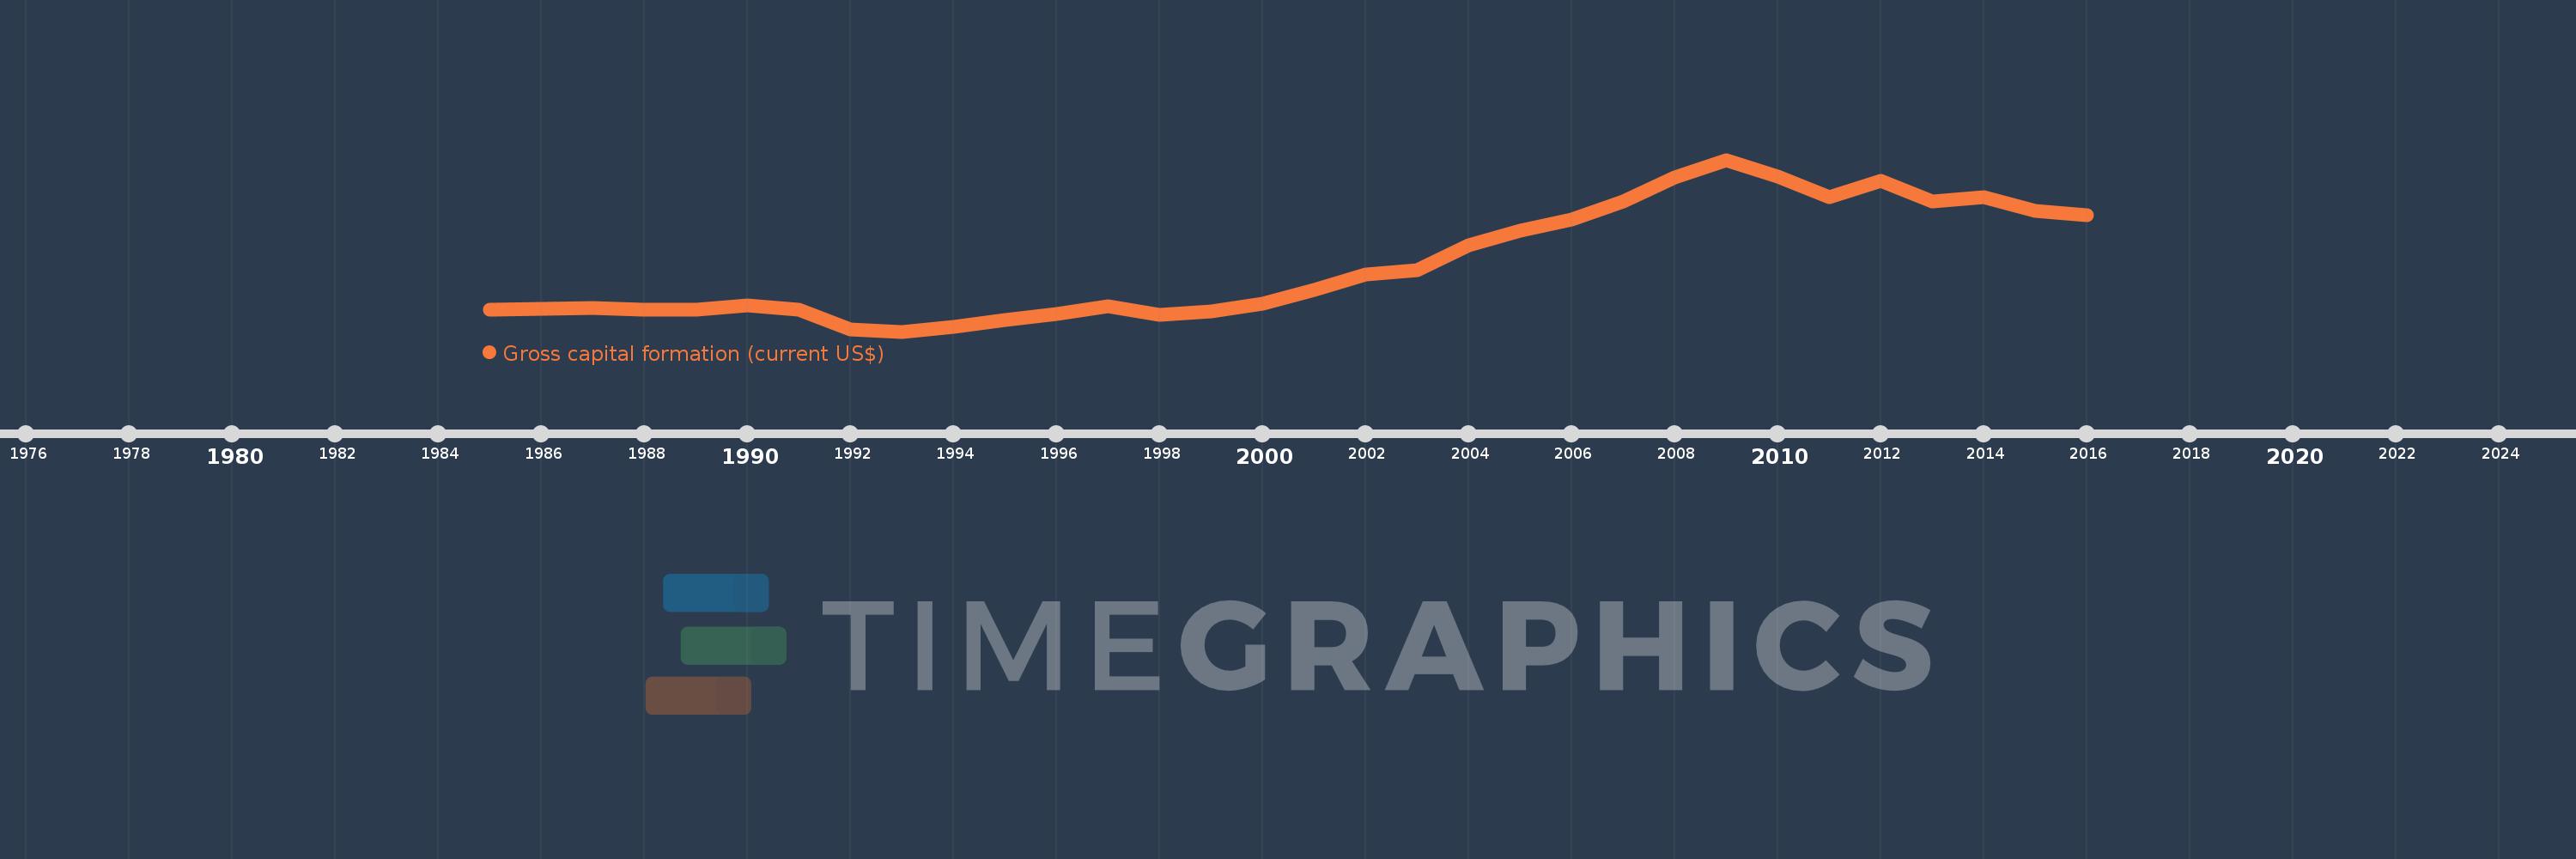
Gross capital formation (current US$)
2016,2015,2014,2013,2012,2011,2010,2009,2008,2007,2006,2005,2004,2003,2002,2001,2000,1999,1998,1997,1996,1995,1994,1993,1992,1991,1990,1989,1988,1987,1986,1985
This statistics in other country:
AfghanistanAlbaniaAlgeriaAngolaAntigua and BarbudaArab WorldArgentinaArmeniaArubaAustraliaAustriaAzerbaijanBahamas, TheBahrainBangladeshBarbadosBelarusBelgiumBelizeBeninBermudaBhutanBoliviaBosnia and HerzegovinaBotswanaBrazilBrunei DarussalamBulgariaBurkina FasoBurundiCabo VerdeCambodiaCameroonCanadaCaribbean small statesCentral African RepublicCentral Europe and the BalticsChadChileChinaColombiaComorosCongo, Dem. Rep.Congo, Rep.Costa RicaCote d'IvoireCroatiaCubaCyprusCzech RepublicDenmarkDjiboutiDominicaDominican RepublicEarly-demographic dividendEast Asia & PacificEast Asia & Pacific (excluding high income)East Asia & Pacific (IDA & IBRD countries)EcuadorEgypt, Arab Rep.El SalvadorEquatorial GuineaEritreaEstoniaEthiopiaEuro areaEurope & Central AsiaEurope & Central Asia (excluding high income)Europe & Central Asia (IDA & IBRD countries)European UnionFaroe IslandsFijiFinlandFragile and conflict affected situationsFranceGabonGambia, TheGeorgiaGermanyGhanaGreeceGrenadaGuatemalaGuineaGuinea-BissauGuyanaHaitiHeavily indebted poor countries (HIPC)High incomeHondurasHong Kong SAR, ChinaHungaryIBRD onlyIcelandIDA & IBRD totalIDA blendIDA onlyIDA totalIndiaIndonesiaIran, Islamic Rep.IraqIrelandIsraelItalyJamaicaJapanJordanKazakhstanKenyaKiribatiKorea, Rep.KosovoKuwaitKyrgyz RepublicLao PDRLate-demographic dividendLatin America & Caribbean Latin America & Caribbean (excluding high income)Latin America & the Caribbean (IDA & IBRD countries)LatviaLeast developed countries: UN classificationLebanonLesothoLiberiaLibyaLithuaniaLow & middle incomeLow incomeLower middle incomeLuxembourgMacao SAR, ChinaMacedonia, FYRMadagascarMalawiMalaysiaMaldivesMaliMaltaMauritaniaMauritiusMexicoMicronesia, Fed. Sts.Middle East & North AfricaMiddle East & North Africa (excluding high income)Middle East & North Africa (IDA & IBRD countries)Middle incomeMoldovaMongoliaMontenegroMoroccoMozambiqueNamibiaNepalNetherlandsNew CaledoniaNew ZealandNicaraguaNigerNigeriaNorth AmericaNorwayOECD membersOmanOther small statesPakistanPanamaPapua New GuineaParaguayPeruPhilippinesPolandPortugalPost-demographic dividendPre-demographic dividendPuerto RicoQatarRomaniaRussian FederationRwandaSaudi ArabiaSenegalSerbiaSeychellesSierra LeoneSingaporeSlovak RepublicSloveniaSmall statesSolomon IslandsSouth AfricaSouth AsiaSouth Asia (IDA & IBRD)South SudanSpainSri LankaSt. Kitts and NevisSt. LuciaSt. Vincent and the GrenadinesSub-Saharan Africa Sub-Saharan Africa (excluding high income)Sub-Saharan Africa (IDA & IBRD countries)SudanSurinameSwazilandSwedenSwitzerlandSyrian Arab RepublicTajikistanTanzaniaThailandTimor-LesteTogoTongaTrinidad and TobagoTunisiaTurkeyTurkmenistanUgandaUkraineUnited Arab EmiratesUnited KingdomUnited StatesUpper middle incomeUruguayUzbekistanVanuatuVenezuela, RBVietnamWest Bank and GazaWorldYemen, Rep.ZambiaZimbabwe Timeline:
This timeline shows a graph from 1985 to 2016 of Albania. No data until 1984. Number of actual observations by date: 32.
Source name:
World Development Indicators
Source organization:
World Bank national accounts data, and OECD National Accounts data files.
Categories, topics:
Economy & Growth
Last updated:
apr 23, 2017
Indicators value changes by year
Minimum:
36.891 mln
jan 1, 1993
Maximum:
4.609 bln
jan 1, 2009
At the date of observation
Value
Absolute change
Change from previous value
jan 1, 1985
611.538 mln
+611.538 mln
0.0%
jan 1, 1986
643.706 mln
+32.168 mln
5.26%
jan 1, 1987
671.875 mln
+28.169 mln
4.38%
jan 1, 1988
612.875 mln
-59.0 mln
-8.78%
jan 1, 1989
614.5 mln
+1.625 mln
0.27%
jan 1, 1990
740.75 mln
+126.25 mln
20.55%
jan 1, 1991
615.888 mln
-124.862 mln
-16.86%
jan 1, 1992
83.601 mln
-532.287 mln
-86.43%
jan 1, 1993
36.891 mln
-46.709 mln
-55.87%
jan 1, 1994
162.105 mln
+125.214 mln
339.41%
jan 1, 1995
355.436 mln
+193.33 mln
119.26%
jan 1, 1996
509.145 mln
+153.709 mln
43.25%
jan 1, 1997
701.245 mln
+192.1 mln
37.73%
jan 1, 1998
483.568 mln
-217.677 mln
-31.04%
jan 1, 1999
569.134 mln
+85.566 mln
17.69%
jan 1, 2000
784.93 mln
+215.797 mln
37.92%
jan 1, 2001
1.153 bln
+367.672 mln
46.84%
jan 1, 2002
1.558 bln
+405.104 mln
35.15%
jan 1, 2003
1.681 bln
+123.287 mln
7.91%
jan 1, 2004
2.326 bln
+644.96 mln
38.37%
jan 1, 2005
2.721 bln
+395.161 mln
16.99%
jan 1, 2006
3.017 bln
+296.339 mln
10.89%
jan 1, 2007
3.505 bln
+487.848 mln
16.17%
jan 1, 2008
4.137 bln
+631.231 mln
18.01%
jan 1, 2009
4.609 bln
+472.212 mln
11.42%
jan 1, 2010
4.162 bln
-446.531 mln
-9.69%
jan 1, 2011
3.615 bln
-547.312 mln
-13.15%
jan 1, 2012
4.049 bln
+434.581 mln
12.02%
jan 1, 2013
3.49 bln
-559.467 mln
-13.82%
jan 1, 2014
3.625 bln
+134.507 mln
3.85%
jan 1, 2015
3.251 bln
-373.636 mln
-10.31%
jan 1, 2016
3.125 bln
-125.423 mln
-3.86%
Ranking of countries by current statistics by years


Comments: