29
/
en
AIzaSyAYiBZKx7MnpbEhh9jyipgxe19OcubqV5w
April 1, 2024
87276
Bolivia
BOL
true
2
1
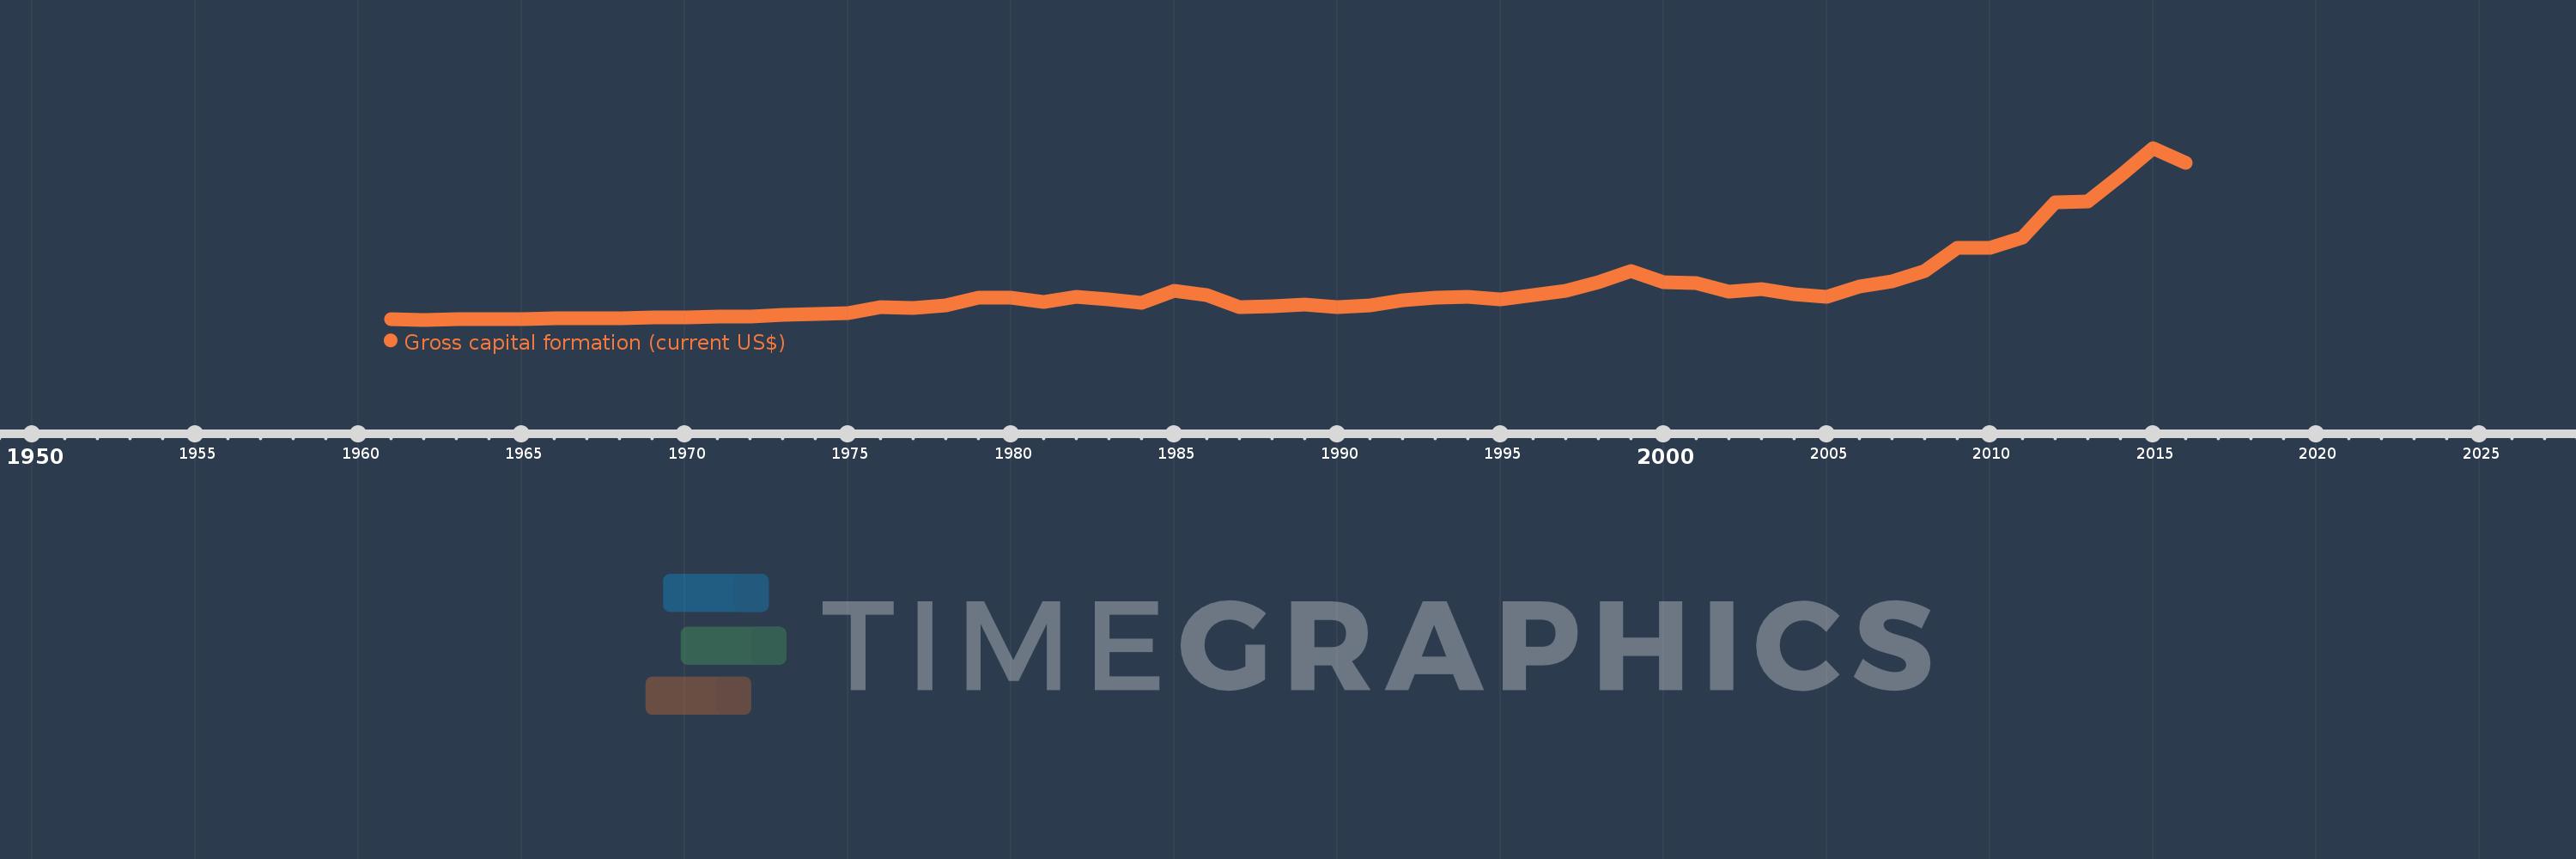
Gross capital formation (current US$)
2016,2015,2014,2013,2012,2011,2010,2009,2008,2007,2006,2005,2004,2003,2002,2001,2000,1999,1998,1997,1996,1995,1994,1993,1992,1991,1990,1989,1988,1987,1986,1985,1984,1983,1982,1981,1980,1979,1978,1977,1976,1975,1974,1973,1972,1971,1970,1969,1968,1967,1966,1965,1964,1963,1962,1961
This statistics in other country:
AfghanistanAlbaniaAlgeriaAngolaAntigua and BarbudaArab WorldArgentinaArmeniaArubaAustraliaAustriaAzerbaijanBahamas, TheBahrainBangladeshBarbadosBelarusBelgiumBelizeBeninBermudaBhutanBoliviaBosnia and HerzegovinaBotswanaBrazilBrunei DarussalamBulgariaBurkina FasoBurundiCabo VerdeCambodiaCameroonCanadaCaribbean small statesCentral African RepublicCentral Europe and the BalticsChadChileChinaColombiaComorosCongo, Dem. Rep.Congo, Rep.Costa RicaCote d'IvoireCroatiaCubaCyprusCzech RepublicDenmarkDjiboutiDominicaDominican RepublicEarly-demographic dividendEast Asia & PacificEast Asia & Pacific (excluding high income)East Asia & Pacific (IDA & IBRD countries)EcuadorEgypt, Arab Rep.El SalvadorEquatorial GuineaEritreaEstoniaEthiopiaEuro areaEurope & Central AsiaEurope & Central Asia (excluding high income)Europe & Central Asia (IDA & IBRD countries)European UnionFaroe IslandsFijiFinlandFragile and conflict affected situationsFranceGabonGambia, TheGeorgiaGermanyGhanaGreeceGrenadaGuatemalaGuineaGuinea-BissauGuyanaHaitiHeavily indebted poor countries (HIPC)High incomeHondurasHong Kong SAR, ChinaHungaryIBRD onlyIcelandIDA & IBRD totalIDA blendIDA onlyIDA totalIndiaIndonesiaIran, Islamic Rep.IraqIrelandIsraelItalyJamaicaJapanJordanKazakhstanKenyaKiribatiKorea, Rep.KosovoKuwaitKyrgyz RepublicLao PDRLate-demographic dividendLatin America & Caribbean Latin America & Caribbean (excluding high income)Latin America & the Caribbean (IDA & IBRD countries)LatviaLeast developed countries: UN classificationLebanonLesothoLiberiaLibyaLithuaniaLow & middle incomeLow incomeLower middle incomeLuxembourgMacao SAR, ChinaMacedonia, FYRMadagascarMalawiMalaysiaMaldivesMaliMaltaMauritaniaMauritiusMexicoMicronesia, Fed. Sts.Middle East & North AfricaMiddle East & North Africa (excluding high income)Middle East & North Africa (IDA & IBRD countries)Middle incomeMoldovaMongoliaMontenegroMoroccoMozambiqueNamibiaNepalNetherlandsNew CaledoniaNew ZealandNicaraguaNigerNigeriaNorth AmericaNorwayOECD membersOmanOther small statesPakistanPanamaPapua New GuineaParaguayPeruPhilippinesPolandPortugalPost-demographic dividendPre-demographic dividendPuerto RicoQatarRomaniaRussian FederationRwandaSaudi ArabiaSenegalSerbiaSeychellesSierra LeoneSingaporeSlovak RepublicSloveniaSmall statesSolomon IslandsSouth AfricaSouth AsiaSouth Asia (IDA & IBRD)South SudanSpainSri LankaSt. Kitts and NevisSt. LuciaSt. Vincent and the GrenadinesSub-Saharan Africa Sub-Saharan Africa (excluding high income)Sub-Saharan Africa (IDA & IBRD countries)SudanSurinameSwazilandSwedenSwitzerlandSyrian Arab RepublicTajikistanTanzaniaThailandTimor-LesteTogoTongaTrinidad and TobagoTunisiaTurkeyTurkmenistanUgandaUkraineUnited Arab EmiratesUnited KingdomUnited StatesUpper middle incomeUruguayUzbekistanVanuatuVenezuela, RBVietnamWest Bank and GazaWorldYemen, Rep.ZambiaZimbabwe Timeline:
This timeline shows a graph from 1961 to 2016 of Bolivia. No data until 1960. Number of actual observations by date: 56.
Source name:
World Development Indicators
Source organization:
World Bank national accounts data, and OECD National Accounts data files.
Categories, topics:
Economy & Growth
Last updated:
apr 23, 2017
Indicators value changes by year
Minimum:
41.737 mln
jan 1, 1962
Maximum:
6.94 bln
jan 1, 2015
At the date of observation
Value
Absolute change
Change from previous value
jan 1, 1961
50.084 mln
+50.084 mln
0.0%
jan 1, 1962
41.737 mln
-8.347 mln
-16.67%
jan 1, 1963
66.779 mln
+25.042 mln
60.0%
jan 1, 1964
66.779 mln
0.0
0.0%
jan 1, 1965
75.126 mln
+8.347 mln
12.5%
jan 1, 1966
92.593 mln
+17.466 mln
23.25%
jan 1, 1967
101.01 mln
+8.418 mln
9.09%
jan 1, 1968
101.01 mln
0.0
0.0%
jan 1, 1969
143.098 mln
+42.088 mln
41.67%
jan 1, 1970
151.515 mln
+8.418 mln
5.88%
jan 1, 1971
166.667 mln
+15.152 mln
10.0%
jan 1, 1972
184.428 mln
+17.761 mln
10.66%
jan 1, 1973
253.253 mln
+68.825 mln
37.32%
jan 1, 1974
257.871 mln
+4.618 mln
1.82%
jan 1, 1975
306.247 mln
+48.376 mln
18.76%
jan 1, 1976
553.623 mln
+247.376 mln
80.78%
jan 1, 1977
524.138 mln
-29.485 mln
-5.33%
jan 1, 1978
618.291 mln
+94.153 mln
17.96%
jan 1, 1979
928.086 mln
+309.795 mln
50.11%
jan 1, 1980
921.027 mln
-7.058 mln
-0.76%
jan 1, 1981
754.929 mln
-166.098 mln
-18.03%
jan 1, 1982
945.665 mln
+190.735 mln
25.27%
jan 1, 1983
874.026 mln
-71.639 mln
-7.58%
jan 1, 1984
717.864 mln
-156.162 mln
-17.87%
jan 1, 1985
1.214 bln
+495.772 mln
69.06%
jan 1, 1986
1.047 bln
-166.985 mln
-13.76%
jan 1, 1987
536.849 mln
-509.802 mln
-48.71%
jan 1, 1988
587.324 mln
+50.474 mln
9.4%
jan 1, 1989
642.782 mln
+55.459 mln
9.44%
jan 1, 1990
546.467 mln
-96.316 mln
-14.98%
jan 1, 1991
610.002 mln
+63.535 mln
11.63%
jan 1, 1992
832.363 mln
+222.361 mln
36.45%
jan 1, 1993
942.775 mln
+110.412 mln
13.26%
jan 1, 1994
949.879 mln
+7.104 mln
0.75%
jan 1, 1995
859.576 mln
-90.302 mln
-9.51%
jan 1, 1996
1.024 bln
+164.092 mln
19.09%
jan 1, 1997
1.201 bln
+177.393 mln
17.33%
jan 1, 1998
1.556 bln
+354.904 mln
29.55%
jan 1, 1999
2.006 bln
+450.008 mln
28.92%
jan 1, 2000
1.555 bln
-450.712 mln
-22.47%
jan 1, 2001
1.524 bln
-31.589 mln
-2.03%
jan 1, 2002
1.162 bln
-362.003 mln
-23.76%
jan 1, 2003
1.288 bln
+126.503 mln
10.89%
jan 1, 2004
1.069 bln
-218.709 mln
-16.98%
jan 1, 2005
966.984 mln
-102.481 mln
-9.58%
jan 1, 2006
1.361 bln
+394.106 mln
40.76%
jan 1, 2007
1.588 bln
+226.75 mln
16.66%
jan 1, 2008
1.992 bln
+404.595 mln
25.48%
jan 1, 2009
2.927 bln
+934.358 mln
46.9%
jan 1, 2010
2.943 bln
+16.085 mln
0.55%
jan 1, 2011
3.342 bln
+398.864 mln
13.55%
jan 1, 2012
4.748 bln
+1.407 bln
42.1%
jan 1, 2013
4.787 bln
+38.236 mln
0.81%
jan 1, 2014
5.831 bln
+1.044 bln
21.81%
jan 1, 2015
6.94 bln
+1.11 bln
19.03%
jan 1, 2016
6.348 bln
-592.619 mln
-8.54%
Ranking of countries by current statistics by years


Comments: