29
/
en
AIzaSyAYiBZKx7MnpbEhh9jyipgxe19OcubqV5w
April 1, 2024
31620
Europe & Central Asia (excluding high income)
ECA
false
2
1
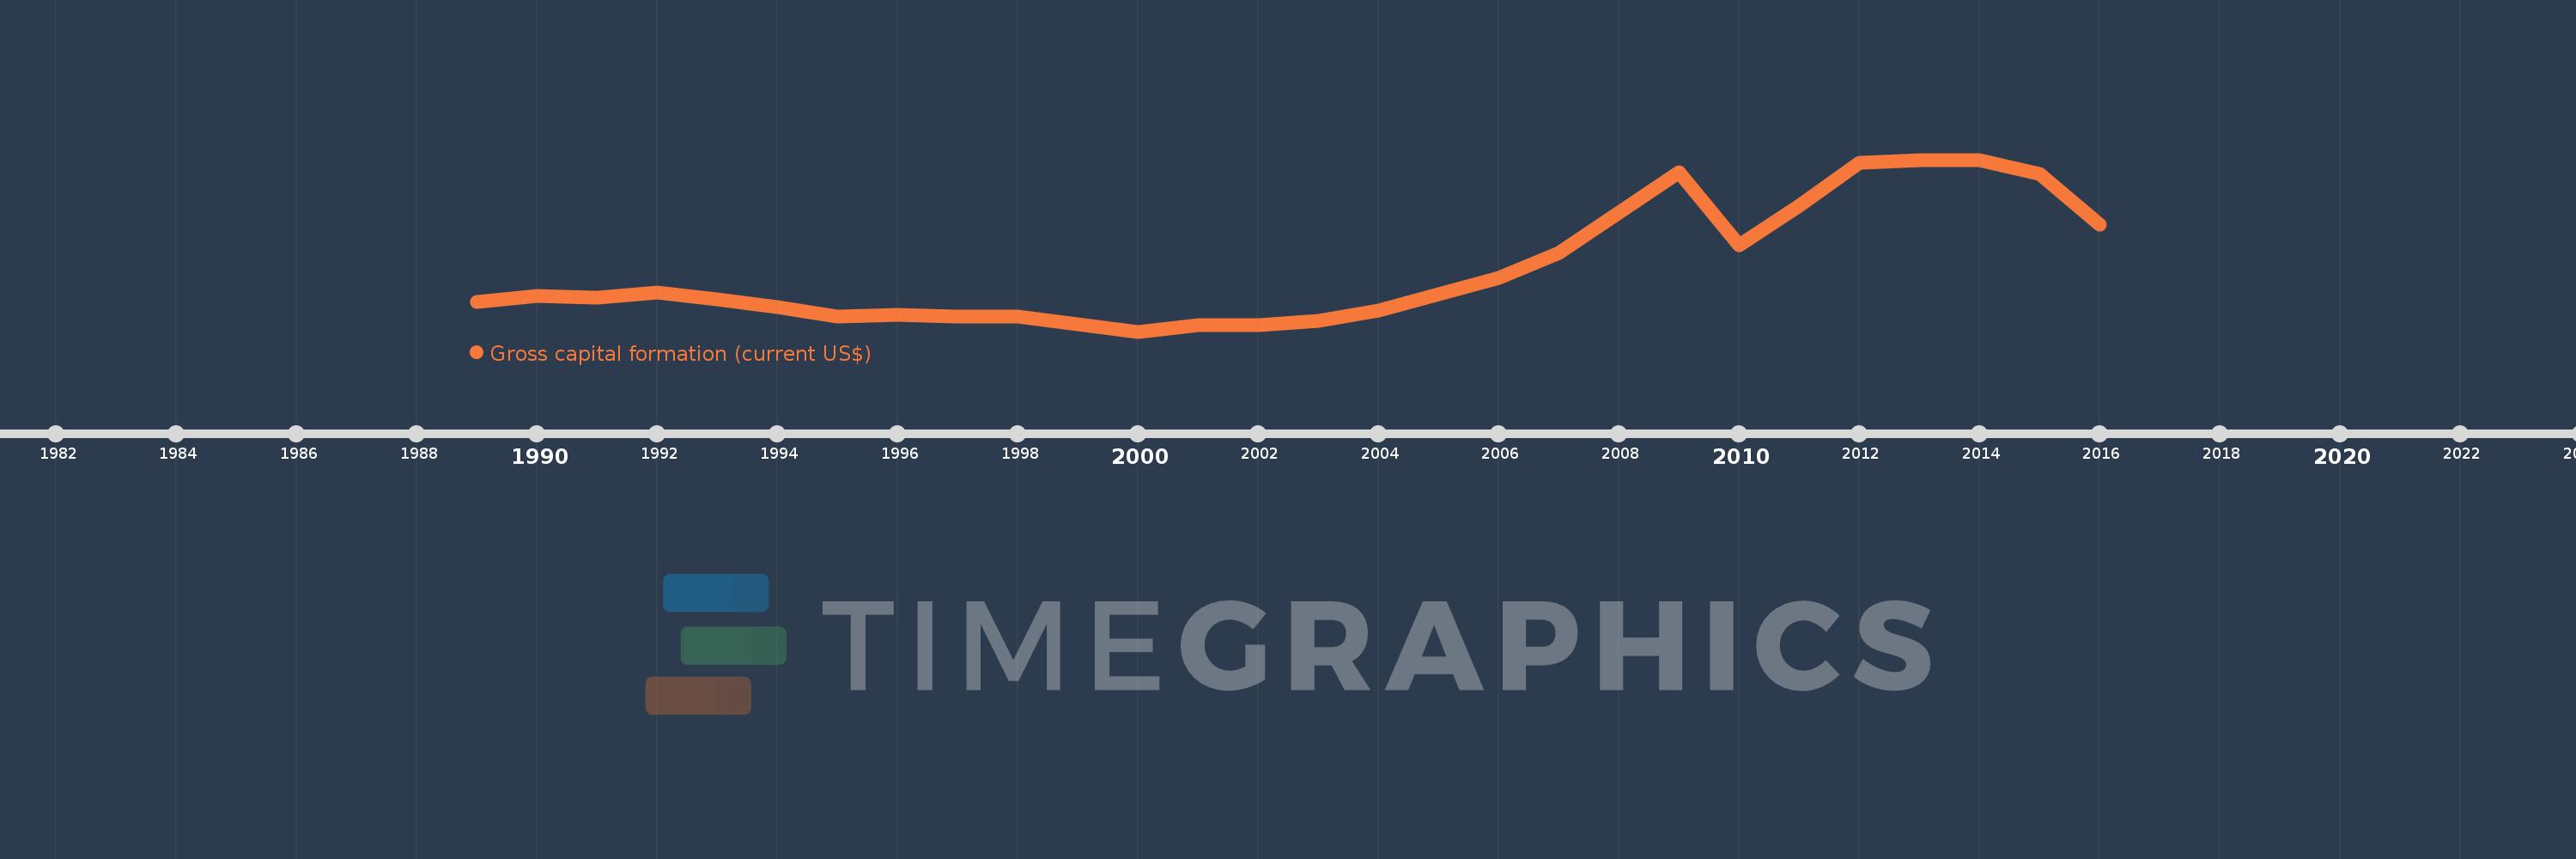
Gross capital formation (current US$)
2016,2015,2014,2013,2012,2011,2010,2009,2008,2007,2006,2005,2004,2003,2002,2001,2000,1999,1998,1997,1996,1995,1994,1993,1992,1991,1990,1989
This statistics in other country:
AfghanistanAlbaniaAlgeriaAngolaAntigua and BarbudaArab WorldArgentinaArmeniaArubaAustraliaAustriaAzerbaijanBahamas, TheBahrainBangladeshBarbadosBelarusBelgiumBelizeBeninBermudaBhutanBoliviaBosnia and HerzegovinaBotswanaBrazilBrunei DarussalamBulgariaBurkina FasoBurundiCabo VerdeCambodiaCameroonCanadaCaribbean small statesCentral African RepublicCentral Europe and the BalticsChadChileChinaColombiaComorosCongo, Dem. Rep.Congo, Rep.Costa RicaCote d'IvoireCroatiaCubaCyprusCzech RepublicDenmarkDjiboutiDominicaDominican RepublicEarly-demographic dividendEast Asia & PacificEast Asia & Pacific (excluding high income)East Asia & Pacific (IDA & IBRD countries)EcuadorEgypt, Arab Rep.El SalvadorEquatorial GuineaEritreaEstoniaEthiopiaEuro areaEurope & Central AsiaEurope & Central Asia (excluding high income)Europe & Central Asia (IDA & IBRD countries)European UnionFaroe IslandsFijiFinlandFragile and conflict affected situationsFranceGabonGambia, TheGeorgiaGermanyGhanaGreeceGrenadaGuatemalaGuineaGuinea-BissauGuyanaHaitiHeavily indebted poor countries (HIPC)High incomeHondurasHong Kong SAR, ChinaHungaryIBRD onlyIcelandIDA & IBRD totalIDA blendIDA onlyIDA totalIndiaIndonesiaIran, Islamic Rep.IraqIrelandIsraelItalyJamaicaJapanJordanKazakhstanKenyaKiribatiKorea, Rep.KosovoKuwaitKyrgyz RepublicLao PDRLate-demographic dividendLatin America & Caribbean Latin America & Caribbean (excluding high income)Latin America & the Caribbean (IDA & IBRD countries)LatviaLeast developed countries: UN classificationLebanonLesothoLiberiaLibyaLithuaniaLow & middle incomeLow incomeLower middle incomeLuxembourgMacao SAR, ChinaMacedonia, FYRMadagascarMalawiMalaysiaMaldivesMaliMaltaMauritaniaMauritiusMexicoMicronesia, Fed. Sts.Middle East & North AfricaMiddle East & North Africa (excluding high income)Middle East & North Africa (IDA & IBRD countries)Middle incomeMoldovaMongoliaMontenegroMoroccoMozambiqueNamibiaNepalNetherlandsNew CaledoniaNew ZealandNicaraguaNigerNigeriaNorth AmericaNorwayOECD membersOmanOther small statesPakistanPanamaPapua New GuineaParaguayPeruPhilippinesPolandPortugalPost-demographic dividendPre-demographic dividendPuerto RicoQatarRomaniaRussian FederationRwandaSaudi ArabiaSenegalSerbiaSeychellesSierra LeoneSingaporeSlovak RepublicSloveniaSmall statesSolomon IslandsSouth AfricaSouth AsiaSouth Asia (IDA & IBRD)South SudanSpainSri LankaSt. Kitts and NevisSt. LuciaSt. Vincent and the GrenadinesSub-Saharan Africa Sub-Saharan Africa (excluding high income)Sub-Saharan Africa (IDA & IBRD countries)SudanSurinameSwazilandSwedenSwitzerlandSyrian Arab RepublicTajikistanTanzaniaThailandTimor-LesteTogoTongaTrinidad and TobagoTunisiaTurkeyTurkmenistanUgandaUkraineUnited Arab EmiratesUnited KingdomUnited StatesUpper middle incomeUruguayUzbekistanVanuatuVenezuela, RBVietnamWest Bank and GazaWorldYemen, Rep.ZambiaZimbabwe Timeline:
This timeline shows a graph from 1989 to 2016 of Europe & Central Asia (excluding high income). No data until 1988. Number of actual observations by date: 28.
Source name:
World Development Indicators
Source organization:
World Bank national accounts data, and OECD National Accounts data files.
Categories, topics:
Economy & Growth
Last updated:
apr 23, 2017
Indicators value changes by year
Minimum:
109.204 bln
jan 1, 2000
Maximum:
905.104 bln
jan 1, 2014
At the date of observation
Value
Absolute change
Change from previous value
jan 1, 1989
246.216 bln
+246.216 bln
0.0%
jan 1, 1990
275.938 bln
+29.722 bln
12.07%
jan 1, 1991
268.207 bln
-7.731 bln
-2.8%
jan 1, 1992
290.76 bln
+22.553 bln
8.41%
jan 1, 1993
257.014 bln
-33.746 bln
-11.61%
jan 1, 1994
222.024 bln
-34.99 bln
-13.61%
jan 1, 1995
176.887 bln
-45.137 bln
-20.33%
jan 1, 1996
187.536 bln
+10.649 bln
6.02%
jan 1, 1997
179.898 bln
-7.638 bln
-4.07%
jan 1, 1998
180.615 bln
+716.663 mln
0.4%
jan 1, 1999
142.938 bln
-37.676 bln
-20.86%
jan 1, 2000
109.204 bln
-33.735 bln
-23.6%
jan 1, 2001
137.942 bln
+28.738 bln
26.32%
jan 1, 2002
140.069 bln
+2.127 bln
1.54%
jan 1, 2003
157.956 bln
+17.887 bln
12.77%
jan 1, 2004
205.225 bln
+47.269 bln
29.93%
jan 1, 2005
283.314 bln
+78.089 bln
38.05%
jan 1, 2006
358.261 bln
+74.947 bln
26.45%
jan 1, 2007
472.96 bln
+114.699 bln
32.02%
jan 1, 2008
658.473 bln
+185.514 bln
39.22%
jan 1, 2009
848.712 bln
+190.238 bln
28.89%
jan 1, 2010
511.072 bln
-337.639 bln
-39.78%
jan 1, 2011
691.78 bln
+180.708 bln
35.36%
jan 1, 2012
892.379 bln
+200.599 bln
29.0%
jan 1, 2013
901.441 bln
+9.062 bln
1.02%
jan 1, 2014
905.104 bln
+3.664 bln
0.41%
jan 1, 2015
840.607 bln
-64.497 bln
-7.13%
jan 1, 2016
605.865 bln
-234.742 bln
-27.93%
Ranking of countries by current statistics by years


Comments: