29
/
en
AIzaSyAYiBZKx7MnpbEhh9jyipgxe19OcubqV5w
April 1, 2024
89851
Botswana
BWA
true
2
1
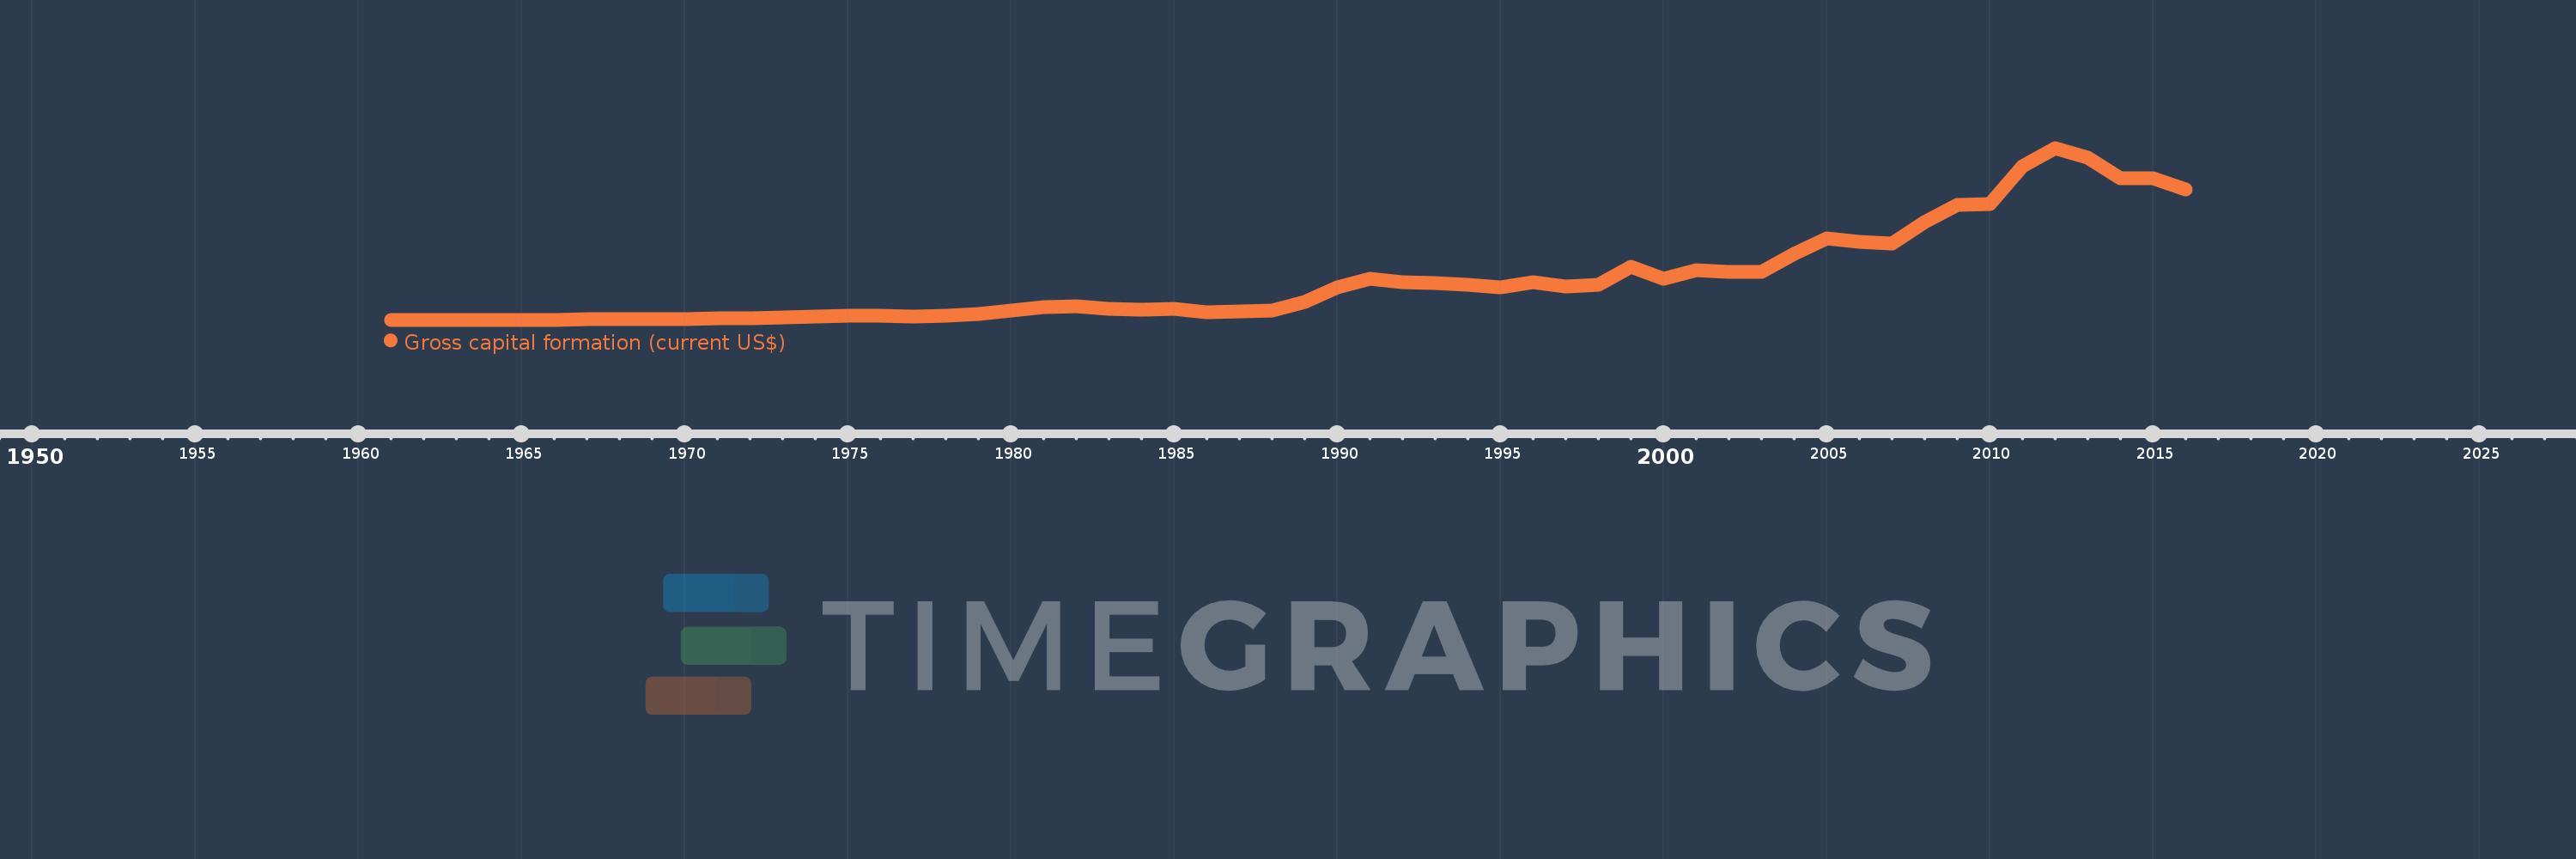
Gross capital formation (current US$)
2016,2015,2014,2013,2012,2011,2010,2009,2008,2007,2006,2005,2004,2003,2002,2001,2000,1999,1998,1997,1996,1995,1994,1993,1992,1991,1990,1989,1988,1987,1986,1985,1984,1983,1982,1981,1980,1979,1978,1977,1976,1975,1974,1973,1972,1971,1970,1969,1968,1967,1966,1965,1964,1963,1962,1961
This statistics in other country:
AfghanistanAlbaniaAlgeriaAngolaAntigua and BarbudaArab WorldArgentinaArmeniaArubaAustraliaAustriaAzerbaijanBahamas, TheBahrainBangladeshBarbadosBelarusBelgiumBelizeBeninBermudaBhutanBoliviaBosnia and HerzegovinaBotswanaBrazilBrunei DarussalamBulgariaBurkina FasoBurundiCabo VerdeCambodiaCameroonCanadaCaribbean small statesCentral African RepublicCentral Europe and the BalticsChadChileChinaColombiaComorosCongo, Dem. Rep.Congo, Rep.Costa RicaCote d'IvoireCroatiaCubaCyprusCzech RepublicDenmarkDjiboutiDominicaDominican RepublicEarly-demographic dividendEast Asia & PacificEast Asia & Pacific (excluding high income)East Asia & Pacific (IDA & IBRD countries)EcuadorEgypt, Arab Rep.El SalvadorEquatorial GuineaEritreaEstoniaEthiopiaEuro areaEurope & Central AsiaEurope & Central Asia (excluding high income)Europe & Central Asia (IDA & IBRD countries)European UnionFaroe IslandsFijiFinlandFragile and conflict affected situationsFranceGabonGambia, TheGeorgiaGermanyGhanaGreeceGrenadaGuatemalaGuineaGuinea-BissauGuyanaHaitiHeavily indebted poor countries (HIPC)High incomeHondurasHong Kong SAR, ChinaHungaryIBRD onlyIcelandIDA & IBRD totalIDA blendIDA onlyIDA totalIndiaIndonesiaIran, Islamic Rep.IraqIrelandIsraelItalyJamaicaJapanJordanKazakhstanKenyaKiribatiKorea, Rep.KosovoKuwaitKyrgyz RepublicLao PDRLate-demographic dividendLatin America & Caribbean Latin America & Caribbean (excluding high income)Latin America & the Caribbean (IDA & IBRD countries)LatviaLeast developed countries: UN classificationLebanonLesothoLiberiaLibyaLithuaniaLow & middle incomeLow incomeLower middle incomeLuxembourgMacao SAR, ChinaMacedonia, FYRMadagascarMalawiMalaysiaMaldivesMaliMaltaMauritaniaMauritiusMexicoMicronesia, Fed. Sts.Middle East & North AfricaMiddle East & North Africa (excluding high income)Middle East & North Africa (IDA & IBRD countries)Middle incomeMoldovaMongoliaMontenegroMoroccoMozambiqueNamibiaNepalNetherlandsNew CaledoniaNew ZealandNicaraguaNigerNigeriaNorth AmericaNorwayOECD membersOmanOther small statesPakistanPanamaPapua New GuineaParaguayPeruPhilippinesPolandPortugalPost-demographic dividendPre-demographic dividendPuerto RicoQatarRomaniaRussian FederationRwandaSaudi ArabiaSenegalSerbiaSeychellesSierra LeoneSingaporeSlovak RepublicSloveniaSmall statesSolomon IslandsSouth AfricaSouth AsiaSouth Asia (IDA & IBRD)South SudanSpainSri LankaSt. Kitts and NevisSt. LuciaSt. Vincent and the GrenadinesSub-Saharan Africa Sub-Saharan Africa (excluding high income)Sub-Saharan Africa (IDA & IBRD countries)SudanSurinameSwazilandSwedenSwitzerlandSyrian Arab RepublicTajikistanTanzaniaThailandTimor-LesteTogoTongaTrinidad and TobagoTunisiaTurkeyTurkmenistanUgandaUkraineUnited Arab EmiratesUnited KingdomUnited StatesUpper middle incomeUruguayUzbekistanVanuatuVenezuela, RBVietnamWest Bank and GazaWorldYemen, Rep.ZambiaZimbabwe Timeline:
This timeline shows a graph from 1961 to 2016 of Botswana. No data until 1960. Number of actual observations by date: 56.
Source name:
World Development Indicators
Source organization:
World Bank national accounts data, and OECD National Accounts data files.
Categories, topics:
Economy & Growth
Last updated:
apr 23, 2017
Indicators value changes by year
Minimum:
1.829 mln
jan 1, 1961
Maximum:
5.922 bln
jan 1, 2012
At the date of observation
Value
Absolute change
Change from previous value
jan 1, 1961
1.829 mln
+1.829 mln
0.0%
jan 1, 1962
2.435 mln
+605.136K
33.08%
jan 1, 1963
3.136 mln
+701.813K
28.83%
jan 1, 1964
3.736 mln
+599.283K
19.11%
jan 1, 1965
5.112 mln
+1.376 mln
36.83%
jan 1, 1966
6.073 mln
+960.898K
18.8%
jan 1, 1967
11.228 mln
+5.155 mln
84.89%
jan 1, 1968
14.922 mln
+3.695 mln
32.91%
jan 1, 1969
20.363 mln
+5.44 mln
36.46%
jan 1, 1970
29.594 mln
+9.231 mln
45.33%
jan 1, 1971
43.62 mln
+14.026 mln
47.4%
jan 1, 1972
64.037 mln
+20.416 mln
46.81%
jan 1, 1973
84.187 mln
+20.15 mln
31.47%
jan 1, 1974
124.259 mln
+40.072 mln
47.6%
jan 1, 1975
146.51 mln
+22.251 mln
17.91%
jan 1, 1976
148.815 mln
+2.305 mln
1.57%
jan 1, 1977
125.638 mln
-23.178 mln
-15.57%
jan 1, 1978
151.136 mln
+25.498 mln
20.29%
jan 1, 1979
214.694 mln
+63.558 mln
42.05%
jan 1, 1980
305.151 mln
+90.457 mln
42.13%
jan 1, 1981
424.909 mln
+119.758 mln
39.25%
jan 1, 1982
466.096 mln
+41.186 mln
9.69%
jan 1, 1983
382.213 mln
-83.882 mln
-18.0%
jan 1, 1984
344.508 mln
-37.705 mln
-9.86%
jan 1, 1985
365.342 mln
+20.834 mln
6.05%
jan 1, 1986
256.338 mln
-109.004 mln
-29.84%
jan 1, 1987
299.205 mln
+42.867 mln
16.72%
jan 1, 1988
304.627 mln
+5.421 mln
1.81%
jan 1, 1989
623.705 mln
+319.079 mln
104.74%
jan 1, 1990
1.114 bln
+489.807 mln
78.53%
jan 1, 1991
1.416 bln
+302.934 mln
27.21%
jan 1, 1992
1.309 bln
-107.038 mln
-7.56%
jan 1, 1993
1.261 bln
-48.068 mln
-3.67%
jan 1, 1994
1.197 bln
-64.087 mln
-5.08%
jan 1, 1995
1.107 bln
-90.571 mln
-7.56%
jan 1, 1996
1.283 bln
+176.739 mln
15.97%
jan 1, 1997
1.136 bln
-146.937 mln
-11.45%
jan 1, 1998
1.207 bln
+70.977 mln
6.25%
jan 1, 1999
1.817 bln
+609.879 mln
50.51%
jan 1, 2000
1.405 bln
-411.948 mln
-22.67%
jan 1, 2001
1.711 bln
+305.121 mln
21.71%
jan 1, 2002
1.641 bln
-69.772 mln
-4.08%
jan 1, 2003
1.642 bln
+1.456 mln
0.09%
jan 1, 2004
2.264 bln
+622.019 mln
37.88%
jan 1, 2005
2.82 bln
+555.567 mln
24.54%
jan 1, 2006
2.696 bln
-123.447 mln
-4.38%
jan 1, 2007
2.623 bln
-72.984 mln
-2.71%
jan 1, 2008
3.368 bln
+745.04 mln
28.4%
jan 1, 2009
3.961 bln
+592.311 mln
17.58%
jan 1, 2010
3.997 bln
+36.314 mln
0.92%
jan 1, 2011
5.295 bln
+1.298 bln
32.48%
jan 1, 2012
5.922 bln
+626.878 mln
11.84%
jan 1, 2013
5.601 bln
-321.173 mln
-5.42%
jan 1, 2014
4.871 bln
-730.229 mln
-13.04%
jan 1, 2015
4.863 bln
-7.335 mln
-0.15%
jan 1, 2016
4.48 bln
-383.817 mln
-7.89%
Ranking of countries by current statistics by years


Comments: