29
/
en
AIzaSyAYiBZKx7MnpbEhh9jyipgxe19OcubqV5w
April 1, 2024
55556
Pre-demographic dividend
PRE
false
2
1
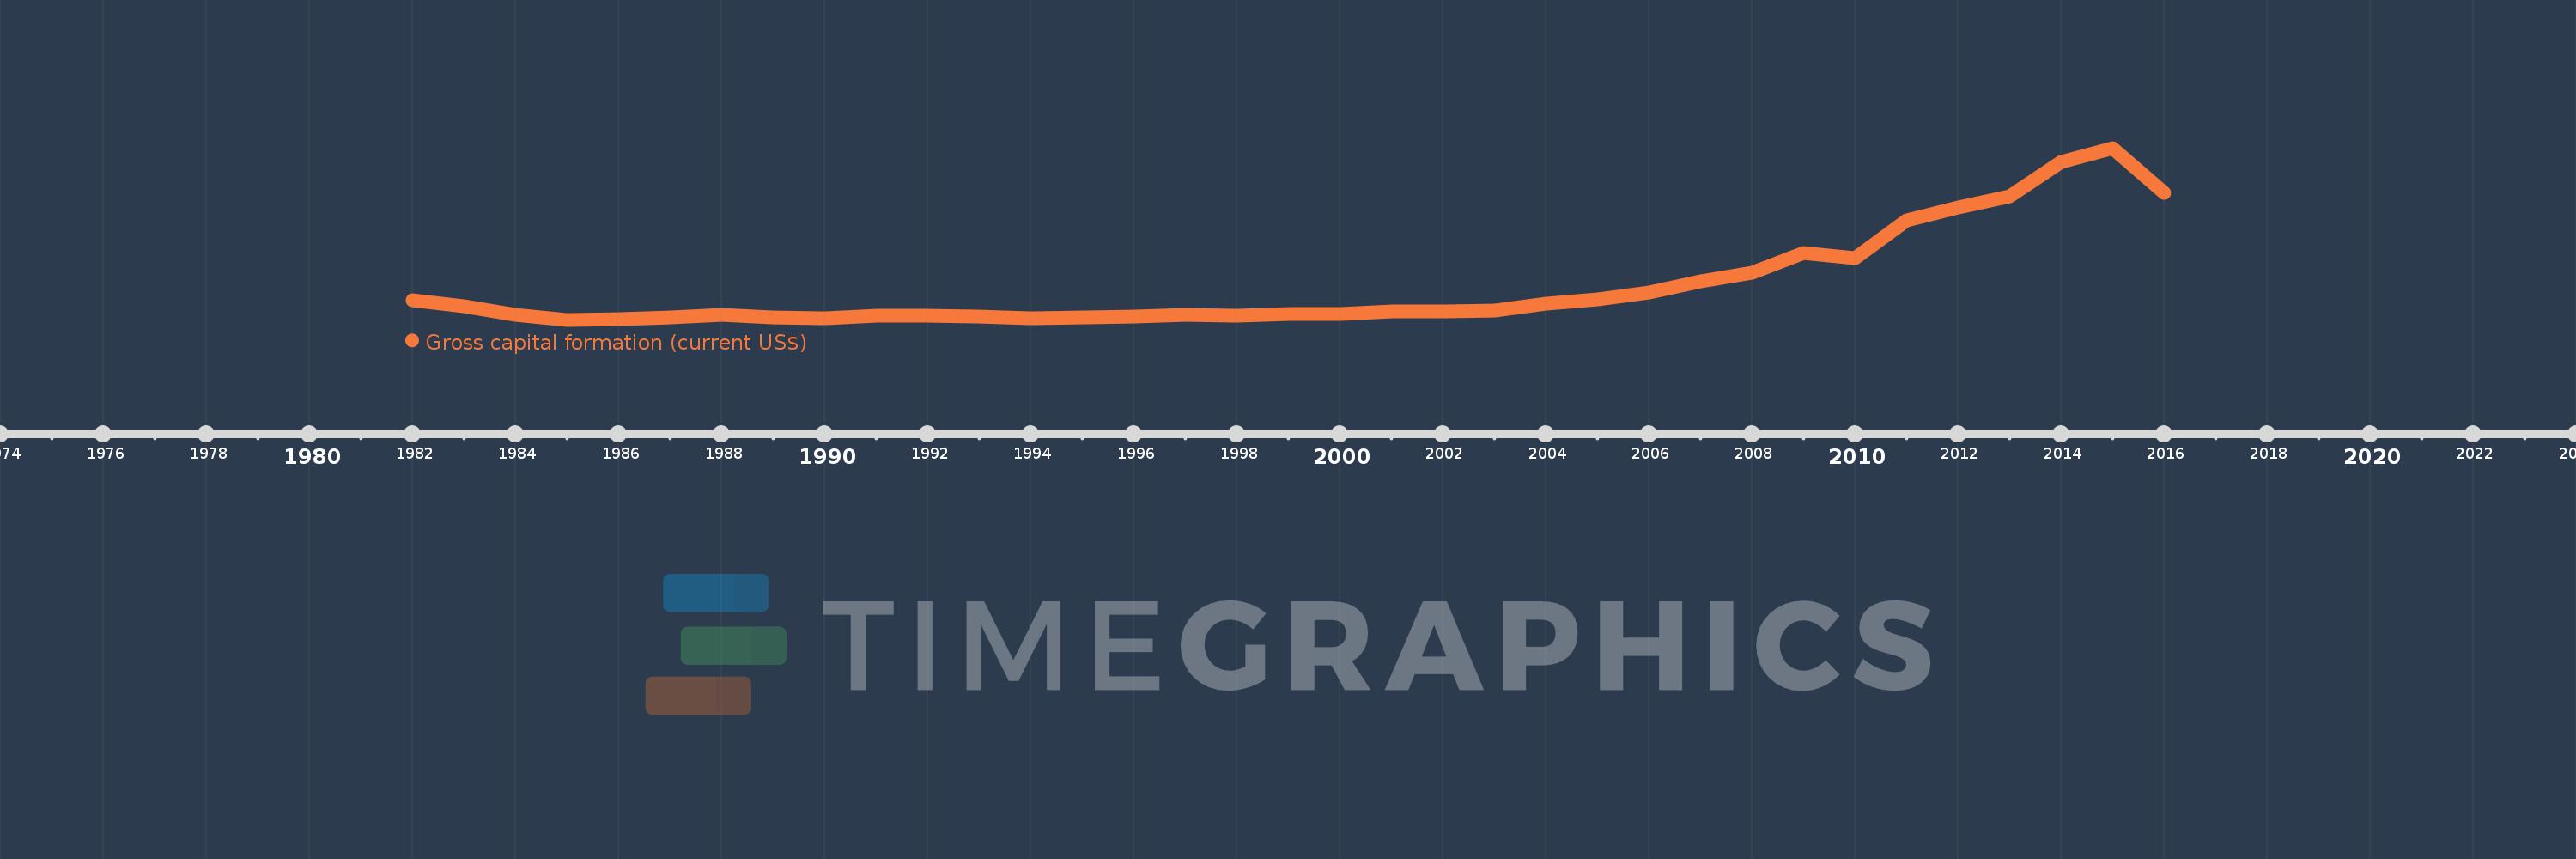
Gross capital formation (current US$)
2016,2015,2014,2013,2012,2011,2010,2009,2008,2007,2006,2005,2004,2003,2002,2001,2000,1999,1998,1997,1996,1995,1994,1993,1992,1991,1990,1989,1988,1987,1986,1985,1984,1983,1982
This statistics in other country:
AfghanistanAlbaniaAlgeriaAngolaAntigua and BarbudaArab WorldArgentinaArmeniaArubaAustraliaAustriaAzerbaijanBahamas, TheBahrainBangladeshBarbadosBelarusBelgiumBelizeBeninBermudaBhutanBoliviaBosnia and HerzegovinaBotswanaBrazilBrunei DarussalamBulgariaBurkina FasoBurundiCabo VerdeCambodiaCameroonCanadaCaribbean small statesCentral African RepublicCentral Europe and the BalticsChadChileChinaColombiaComorosCongo, Dem. Rep.Congo, Rep.Costa RicaCote d'IvoireCroatiaCubaCyprusCzech RepublicDenmarkDjiboutiDominicaDominican RepublicEarly-demographic dividendEast Asia & PacificEast Asia & Pacific (excluding high income)East Asia & Pacific (IDA & IBRD countries)EcuadorEgypt, Arab Rep.El SalvadorEquatorial GuineaEritreaEstoniaEthiopiaEuro areaEurope & Central AsiaEurope & Central Asia (excluding high income)Europe & Central Asia (IDA & IBRD countries)European UnionFaroe IslandsFijiFinlandFragile and conflict affected situationsFranceGabonGambia, TheGeorgiaGermanyGhanaGreeceGrenadaGuatemalaGuineaGuinea-BissauGuyanaHaitiHeavily indebted poor countries (HIPC)High incomeHondurasHong Kong SAR, ChinaHungaryIBRD onlyIcelandIDA & IBRD totalIDA blendIDA onlyIDA totalIndiaIndonesiaIran, Islamic Rep.IraqIrelandIsraelItalyJamaicaJapanJordanKazakhstanKenyaKiribatiKorea, Rep.KosovoKuwaitKyrgyz RepublicLao PDRLate-demographic dividendLatin America & Caribbean Latin America & Caribbean (excluding high income)Latin America & the Caribbean (IDA & IBRD countries)LatviaLeast developed countries: UN classificationLebanonLesothoLiberiaLibyaLithuaniaLow & middle incomeLow incomeLower middle incomeLuxembourgMacao SAR, ChinaMacedonia, FYRMadagascarMalawiMalaysiaMaldivesMaliMaltaMauritaniaMauritiusMexicoMicronesia, Fed. Sts.Middle East & North AfricaMiddle East & North Africa (excluding high income)Middle East & North Africa (IDA & IBRD countries)Middle incomeMoldovaMongoliaMontenegroMoroccoMozambiqueNamibiaNepalNetherlandsNew CaledoniaNew ZealandNicaraguaNigerNigeriaNorth AmericaNorwayOECD membersOmanOther small statesPakistanPanamaPapua New GuineaParaguayPeruPhilippinesPolandPortugalPost-demographic dividendPre-demographic dividendPuerto RicoQatarRomaniaRussian FederationRwandaSaudi ArabiaSenegalSerbiaSeychellesSierra LeoneSingaporeSlovak RepublicSloveniaSmall statesSolomon IslandsSouth AfricaSouth AsiaSouth Asia (IDA & IBRD)South SudanSpainSri LankaSt. Kitts and NevisSt. LuciaSt. Vincent and the GrenadinesSub-Saharan Africa Sub-Saharan Africa (excluding high income)Sub-Saharan Africa (IDA & IBRD countries)SudanSurinameSwazilandSwedenSwitzerlandSyrian Arab RepublicTajikistanTanzaniaThailandTimor-LesteTogoTongaTrinidad and TobagoTunisiaTurkeyTurkmenistanUgandaUkraineUnited Arab EmiratesUnited KingdomUnited StatesUpper middle incomeUruguayUzbekistanVanuatuVenezuela, RBVietnamWest Bank and GazaWorldYemen, Rep.ZambiaZimbabwe Timeline:
This timeline shows a graph from 1982 to 2016 of Pre-demographic dividend. No data until 1981. Number of actual observations by date: 35.
Source name:
World Development Indicators
Source organization:
World Bank national accounts data, and OECD National Accounts data files.
Categories, topics:
Economy & Growth
Last updated:
apr 23, 2017
Indicators value changes by year
Minimum:
18.863 bln
jan 1, 1985
Maximum:
316.913 bln
jan 1, 2015
At the date of observation
Value
Absolute change
Change from previous value
jan 1, 1982
52.371 bln
+52.371 bln
0.0%
jan 1, 1983
42.733 bln
-9.638 bln
-18.4%
jan 1, 1984
27.636 bln
-15.098 bln
-35.33%
jan 1, 1985
18.863 bln
-8.773 bln
-31.74%
jan 1, 1986
19.801 bln
+938.407 mln
4.97%
jan 1, 1987
23.589 bln
+3.788 bln
19.13%
jan 1, 1988
27.284 bln
+3.695 bln
15.66%
jan 1, 1989
22.668 bln
-4.616 bln
-16.92%
jan 1, 1990
21.501 bln
-1.167 bln
-5.15%
jan 1, 1991
26.542 bln
+5.041 bln
23.45%
jan 1, 1992
26.131 bln
-410.595 mln
-1.55%
jan 1, 1993
23.929 bln
-2.202 bln
-8.43%
jan 1, 1994
21.621 bln
-2.308 bln
-9.65%
jan 1, 1995
22.687 bln
+1.066 bln
4.93%
jan 1, 1996
24.816 bln
+2.129 bln
9.38%
jan 1, 1997
27.216 bln
+2.401 bln
9.67%
jan 1, 1998
26.488 bln
-728.409 mln
-2.68%
jan 1, 1999
28.793 bln
+2.305 bln
8.7%
jan 1, 2000
29.063 bln
+270.622 mln
0.94%
jan 1, 2001
33.251 bln
+4.188 bln
14.41%
jan 1, 2002
33.413 bln
+162.347 mln
0.49%
jan 1, 2003
35.255 bln
+1.841 bln
5.51%
jan 1, 2004
47.366 bln
+12.111 bln
34.35%
jan 1, 2005
54.365 bln
+6.999 bln
14.78%
jan 1, 2006
66.613 bln
+12.248 bln
22.53%
jan 1, 2007
85.273 bln
+18.661 bln
28.01%
jan 1, 2008
101.009 bln
+15.735 bln
18.45%
jan 1, 2009
134.913 bln
+33.904 bln
33.57%
jan 1, 2010
125.413 bln
-9.5 bln
-7.04%
jan 1, 2011
191.691 bln
+66.278 bln
52.85%
jan 1, 2012
214.041 bln
+22.35 bln
11.66%
jan 1, 2013
233.162 bln
+19.121 bln
8.93%
jan 1, 2014
293.296 bln
+60.134 bln
25.79%
jan 1, 2015
316.913 bln
+23.617 bln
8.05%
jan 1, 2016
239.301 bln
-77.612 bln
-24.49%
Ranking of countries by current statistics by years


Comments: